Figures & data
Figure 1. Efficiency of the RIVET system in EHEC. Indicated strains carrying tnpR gene under the control of chuA promoter were grown in LB supplemented with various concentrations of 2,2ʹ-dipyridyl. After 6 h of growth, cultures were enumerated on LB plates and on LB + sucrose plates to calculate the percentage of resolved CFU. Results are presented as mean and standard deviations from at least three independent experiments. Blue and red curves represent resolution obtained from the 3 tnpR variants inserted into EDL-RES and EDL-RES1 strains, respectively.
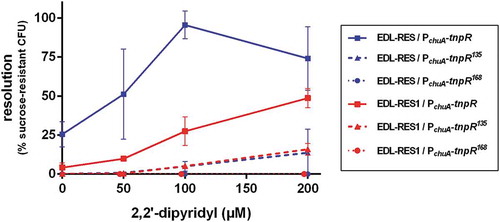
Figure 2. Resolution of selected ivi genes following in vitro or in vivo growth. EDL-RES strain carrying transcriptional fusion between indicated gene promoters and tnpR gene were either grown in vitro for 6 h in LB or were given to mice by oral gavage and feces were collected 16 h post-infection. Samples were then diluted and plated on LB plates or LB + sucrose plates to calculate the percentage of resolved CFU after in vitro growth (white bars) or following mouse challenge (black bars). Results are presented as mean and standard deviations from at least three independent experiments. Differences between in vitro and in vivo conditions were analyzed by a two-tailed unpaired t-test (*P < 0.05; **P < 0.01).
Table 1. List of in vivo-induced genes identified in EHEC O157:H7 strain EDL933.
Table 2. Distribution of eight ivi genes in 51 E. coli strains grouped as commensals, InPEC or ExPEC.
Table 3. Distribution of the eight ivi genes in 228 EHEC strains classified by serotypes.
Figure 3. Distribution of the eight ivi genes in the EHEC strain collection. A phylogenetic tree was constructed after a core-genome multi-alignment with all 228 STEC strains and the O157 E. coli reference genome (NC_002695). Presence of each ivi gene is indicated by different coloured forms. Phylogroups are shown by colorizing the numbering of each strain and serotypes are written. All this information is indicated at the end of each branch of the phylogenetic tree.
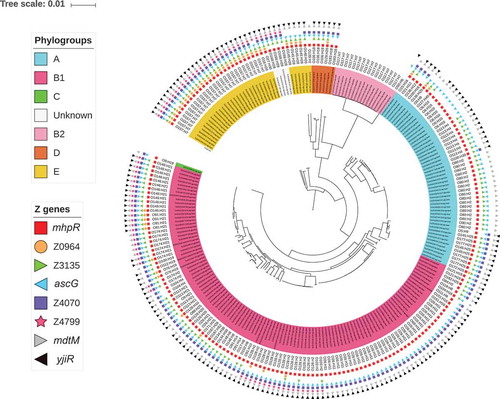
Table 4. Co-distribution of the eight ivi genes with known virulence factors in the EHEC strain collection.
Table 5. Distribution of stx, eae, and the eight ivi genes in EHEC strains with regards to the symptoms they have caused in patients.
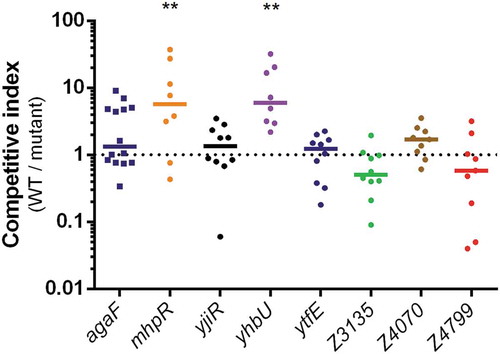
Figure 4. Impact of ivi gene deletion on the fitness of EDL933. Competition assays were performed by co-infecting mice with an equal mixture of EDL933 WT (SmR) and the indicated ivi gene mutant (SmR KanR). Eight days post-infection, faeces were sampled, homogenized in PBS, diluted and spotted on LB + Sm plates and LB + Sm + Kan plates to count, respectively, WT + ivi mutant and ivi mutant alone. The WT population was obtained by subtracting ivi mutant CFU from total EHEC CFU. Competitive indices (ratio WT/mutant) were calculated for each animal. Each dot represents one mouse and lines represent median values. Differences between each group and the control group agaF were analyzed by ANOVA with Fisher’s LSD test (** P < 0.01).