2,338
Views
0
CrossRef citations to date
0
Altmetric
Special Focus on Autophagy in host-pathogen interactions

Autophagy plays a protective role against Trypanosoma cruzi infection in mice

, , , ORCID Icon & ORCID Icon
Pages 151-165 | Received 18 Sep 2018, Accepted 13 Feb 2019, Published online: 04 Mar 2019

Figures & data

Figure 1. The deficiency of autophagy exacerbates T. cruzi infection in mice: (a): Parasitemia curve obtained from C57BL/6J wild type mice (Bcln+/+) and Beclin-1 heterozygous knock-out mice (Bcln±) infected with T. cruzi trypomastigotes of Y-GFP strain as described in materials and methods (Mann-Whitney test, * p < 0.05, *** p˂0.001). (b): Percentage of survival of Bcln+/+ and Bcln± infected with T. cruzi Y-GFP. Data were obtained from three independent experiments of at least 4 mice each (log rank Mantel-Cox test, ** p˂0.01). (c): Cardiac histopathology by H&E staining. Arrows indicate nests of amastigotes. (d): Number of amastigotes nests in cardiac semi-serial sections. Data were obtained from two independent experiments of at least 4 mice each (Mann-Whitney test, * p < 0.05). (e): Representative image showing the expression of Beclin-1 in the liver of non-infected Bcln+/+ and Bcln± mice by western blot. Graphic shows the OD of Beclin-1 band relative to β-Actin expression. Bars indicate the mean ± the standard error of two independent experiments with at least 2 mice each (Student´s t-test, * p < 0.05). F: Representative image showing the expression of LC3 forms in the liver of non-infected Bcln+/+ and Bcln± mice by western blot. Graphic shows the OD of LC3-II relative to β-actin expression. Bars indicate the mean ± the standard error of two independent experiments of at least 2 mice each (Student´s t-test, * p < 0.05).
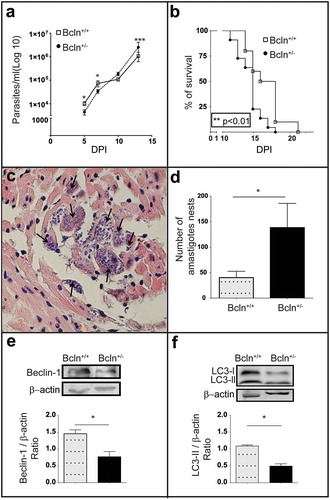
Figure 1. The deficiency of autophagy exacerbates T. cruzi infection in mice: (a): Parasitemia curve obtained from C57BL/6J wild type mice (Bcln+/+) and Beclin-1 heterozygous knock-out mice (Bcln±) infected with T. cruzi trypomastigotes of Y-GFP strain as described in materials and methods (Mann-Whitney test, * p < 0.05, *** p˂0.001). (b): Percentage of survival of Bcln+/+ and Bcln± infected with T. cruzi Y-GFP. Data were obtained from three independent experiments of at least 4 mice each (log rank Mantel-Cox test, ** p˂0.01). (c): Cardiac histopathology by H&E staining. Arrows indicate nests of amastigotes. (d): Number of amastigotes nests in cardiac semi-serial sections. Data were obtained from two independent experiments of at least 4 mice each (Mann-Whitney test, * p < 0.05). (e): Representative image showing the expression of Beclin-1 in the liver of non-infected Bcln+/+ and Bcln± mice by western blot. Graphic shows the OD of Beclin-1 band relative to β-Actin expression. Bars indicate the mean ± the standard error of two independent experiments with at least 2 mice each (Student´s t-test, * p < 0.05). F: Representative image showing the expression of LC3 forms in the liver of non-infected Bcln+/+ and Bcln± mice by western blot. Graphic shows the OD of LC3-II relative to β-actin expression. Bars indicate the mean ± the standard error of two independent experiments of at least 2 mice each (Student´s t-test, * p < 0.05).

Figure 2. Inhibition of autophagy increases T. cruzi infection in Bcln+/+ mice. C57BL/6J wild type mice (Bcln+/+) were treated with CQ (10 mg/Kg/day) and DFMO (1 mg/g/day) for two days before infection and throughout the experiment as described in materials and methods. (a and e): Parasitemia curves obtained from these animals in comparison with non-treated Bcln+/+ mice. Data were obtained from three independent experiments of at least 4 mice each (Mann-Whitney test, * p < 0.05). (b and f): Survival analysis. Data were obtained from three independent experiments of at least 4 mice each (Log rank Mantel-Cox test) (c and g): Number of amastigotes in cardiac tissue from control and treated mice. Data were obtained from two independent experiments of at least 4 mice each (Mann-Whitney test, * p < 0.05). (d and h): Representative images showing the expression of LC3 forms in the liver of non-infected control or treated Bcln+/+ mice by western blot. Graphics show the OD of LC3-II relative to tubulin expression. Bars indicate the mean ± the standard error of two independent experiments of at least 2 mice each (Student´s t-test, *** p < 0.001).
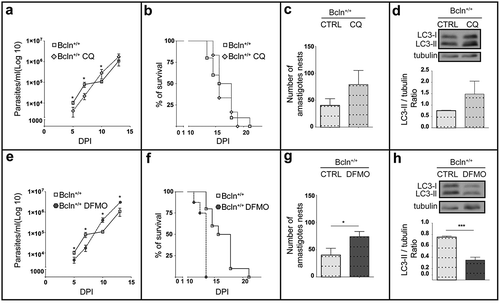
Figure 2. Inhibition of autophagy increases T. cruzi infection in Bcln+/+ mice. C57BL/6J wild type mice (Bcln+/+) were treated with CQ (10 mg/Kg/day) and DFMO (1 mg/g/day) for two days before infection and throughout the experiment as described in materials and methods. (a and e): Parasitemia curves obtained from these animals in comparison with non-treated Bcln+/+ mice. Data were obtained from three independent experiments of at least 4 mice each (Mann-Whitney test, * p < 0.05). (b and f): Survival analysis. Data were obtained from three independent experiments of at least 4 mice each (Log rank Mantel-Cox test) (c and g): Number of amastigotes in cardiac tissue from control and treated mice. Data were obtained from two independent experiments of at least 4 mice each (Mann-Whitney test, * p < 0.05). (d and h): Representative images showing the expression of LC3 forms in the liver of non-infected control or treated Bcln+/+ mice by western blot. Graphics show the OD of LC3-II relative to tubulin expression. Bars indicate the mean ± the standard error of two independent experiments of at least 2 mice each (Student´s t-test, *** p < 0.001).

Figure 3. Inhibition of autophagy increases T. cruzi infection in peritoneal cells. Peritoneal cells were isolated by lavage of the peritoneal cavity of Bcln+/+ or Bcln± mice and then infected with T. cruzi (MOI = 10) for 24 h before fixation. Samples, were then stained with TRITC-phalloidin and Hoechst and processed by confocal microscopy (see details in materials and methods). Other samples from Bcln+/+ mice were treated with 20 μM CQ or 10 mM DFMO from 2 h before and during infection and then processed as above. (a): Scheme of the infection protocol. (b): Representative images depicting the level of cellular infection under the indicated conditions. Parasites were visualized in green, actin cytoskeleton in red and the nuclei in blue. Bars: 5 µm. (c): Percentage of infected cells in the indicated conditions. Bars indicate the mean ± the standard error of at least three independent experiments. Number of counted cells: 100 to 300 cells each experiment (Dunnet test, * p < 0.05; ** p < 0.01).
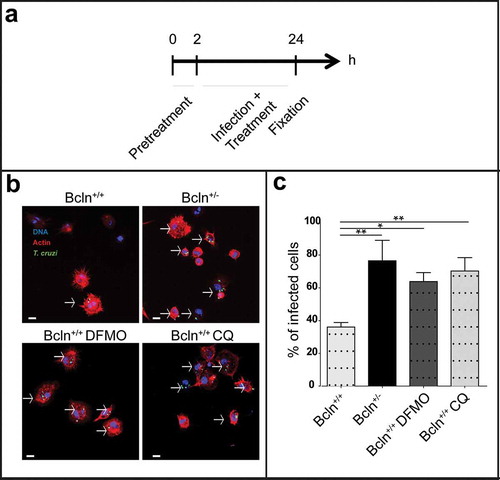
Figure 3. Inhibition of autophagy increases T. cruzi infection in peritoneal cells. Peritoneal cells were isolated by lavage of the peritoneal cavity of Bcln+/+ or Bcln± mice and then infected with T. cruzi (MOI = 10) for 24 h before fixation. Samples, were then stained with TRITC-phalloidin and Hoechst and processed by confocal microscopy (see details in materials and methods). Other samples from Bcln+/+ mice were treated with 20 μM CQ or 10 mM DFMO from 2 h before and during infection and then processed as above. (a): Scheme of the infection protocol. (b): Representative images depicting the level of cellular infection under the indicated conditions. Parasites were visualized in green, actin cytoskeleton in red and the nuclei in blue. Bars: 5 µm. (c): Percentage of infected cells in the indicated conditions. Bars indicate the mean ± the standard error of at least three independent experiments. Number of counted cells: 100 to 300 cells each experiment (Dunnet test, * p < 0.05; ** p < 0.01).

Figure 4. Autophagy participates in the control of T. cruzi infection by macrophages. RAW macrophages were infected for 24 h, washed and fixed or incubated for 24 or 48 h more before fixation. Fixed samples were then processed for microscopy (see details in materials and methods). Other samples were treated with 10 mM DFMO or 20 μM CQ for 2 h before infection (pre-treatment) and maintained in the same conditions during infection and chase periods followed by fixation and processing. (a): Scheme of the protocol. (b): Percentage of macrophages infected at progressive times in control conditions. Bars indicate the mean ± the standard error of at least four independent experiments. Number of counted cells: 100 (Tukey test, *p < 0.05; **p < 0.01). (c): Representative images depicting the level of cellular infection at 24 h under the indicated conditions. Parasites were visualized in green, actin cytoskeleton in red and the nuclei in blue. Bars: 5 μm. (d): Percentage of infected cells in the absence (control) or the presence of the autophagic inhibitors DFMO or CQ at each indicated time. Bars indicate the mean ± the standard error of at least three independent experiments. Number of counted cells: 100 to 300 cells each experiment (Tukey test, * p < 0.05; **p < 0.01; ***p < 0.001).
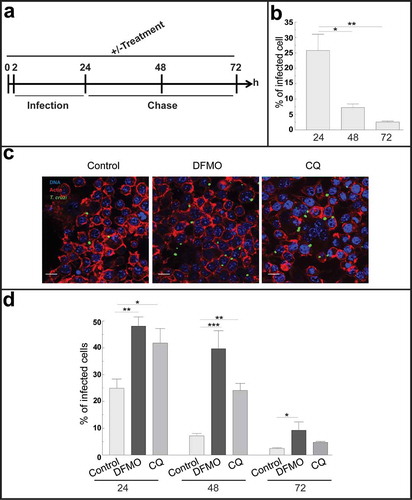
Figure 4. Autophagy participates in the control of T. cruzi infection by macrophages. RAW macrophages were infected for 24 h, washed and fixed or incubated for 24 or 48 h more before fixation. Fixed samples were then processed for microscopy (see details in materials and methods). Other samples were treated with 10 mM DFMO or 20 μM CQ for 2 h before infection (pre-treatment) and maintained in the same conditions during infection and chase periods followed by fixation and processing. (a): Scheme of the protocol. (b): Percentage of macrophages infected at progressive times in control conditions. Bars indicate the mean ± the standard error of at least four independent experiments. Number of counted cells: 100 (Tukey test, *p < 0.05; **p < 0.01). (c): Representative images depicting the level of cellular infection at 24 h under the indicated conditions. Parasites were visualized in green, actin cytoskeleton in red and the nuclei in blue. Bars: 5 μm. (d): Percentage of infected cells in the absence (control) or the presence of the autophagic inhibitors DFMO or CQ at each indicated time. Bars indicate the mean ± the standard error of at least three independent experiments. Number of counted cells: 100 to 300 cells each experiment (Tukey test, * p < 0.05; **p < 0.01; ***p < 0.001).

Figure 5. Macrophages eliminate intracellular parasites by xenophagy. RAW macrophages were infected for 24 h, washed and incubated for an additional period of 24 h in control medium or in the presence of 20 μM CQ or 1 mM DFMO before fixation. Fixed cells were then processed to detect LC3, ubiquitin, p62 or NDP52 by indirect immunofluorescence (see details in materials and methods). (a): Images depicting intracellular parasites (visualized in green and blue) surrounded by LC3 protein (in red). Insets show LC3 position of four different stacks of an amastigote. Bars: 5 µm. (b): Percentage of parasites surrounded by LC3 at different conditions. Bars indicate the mean ± the standard error of at least three independent experiments. Number of counted cells: 100 to 300 cells each experiment (Dunnet test, ***p < 0.001). (c): Images depicting different autophagy/xenophagy markers (in red) recruited to T. cruzi amastigotes (in green and blue).
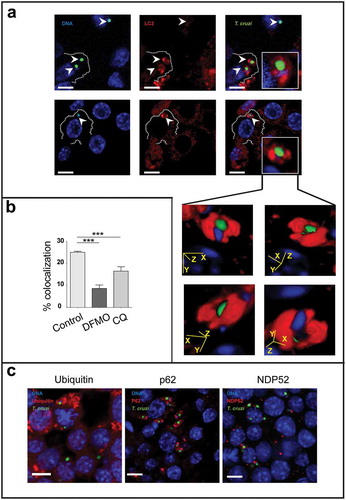
Figure 5. Macrophages eliminate intracellular parasites by xenophagy. RAW macrophages were infected for 24 h, washed and incubated for an additional period of 24 h in control medium or in the presence of 20 μM CQ or 1 mM DFMO before fixation. Fixed cells were then processed to detect LC3, ubiquitin, p62 or NDP52 by indirect immunofluorescence (see details in materials and methods). (a): Images depicting intracellular parasites (visualized in green and blue) surrounded by LC3 protein (in red). Insets show LC3 position of four different stacks of an amastigote. Bars: 5 µm. (b): Percentage of parasites surrounded by LC3 at different conditions. Bars indicate the mean ± the standard error of at least three independent experiments. Number of counted cells: 100 to 300 cells each experiment (Dunnet test, ***p < 0.001). (c): Images depicting different autophagy/xenophagy markers (in red) recruited to T. cruzi amastigotes (in green and blue).
Supplemental material

Supplemental Material

Download TIFF Image (1.9 MB)

Supplemental Material

Download TIFF Image (10 MB)