Figures & data
Figure 1. The deficiency of autophagy exacerbates T. cruzi infection in mice: (a): Parasitemia curve obtained from C57BL/6J wild type mice (Bcln+/+) and Beclin-1 heterozygous knock-out mice (Bcln±) infected with T. cruzi trypomastigotes of Y-GFP strain as described in materials and methods (Mann-Whitney test, * p < 0.05, *** p˂0.001). (b): Percentage of survival of Bcln+/+ and Bcln± infected with T. cruzi Y-GFP. Data were obtained from three independent experiments of at least 4 mice each (log rank Mantel-Cox test, ** p˂0.01). (c): Cardiac histopathology by H&E staining. Arrows indicate nests of amastigotes. (d): Number of amastigotes nests in cardiac semi-serial sections. Data were obtained from two independent experiments of at least 4 mice each (Mann-Whitney test, * p < 0.05). (e): Representative image showing the expression of Beclin-1 in the liver of non-infected Bcln+/+ and Bcln± mice by western blot. Graphic shows the OD of Beclin-1 band relative to β-Actin expression. Bars indicate the mean ± the standard error of two independent experiments with at least 2 mice each (Student´s t-test, * p < 0.05). F: Representative image showing the expression of LC3 forms in the liver of non-infected Bcln+/+ and Bcln± mice by western blot. Graphic shows the OD of LC3-II relative to β-actin expression. Bars indicate the mean ± the standard error of two independent experiments of at least 2 mice each (Student´s t-test, * p < 0.05).
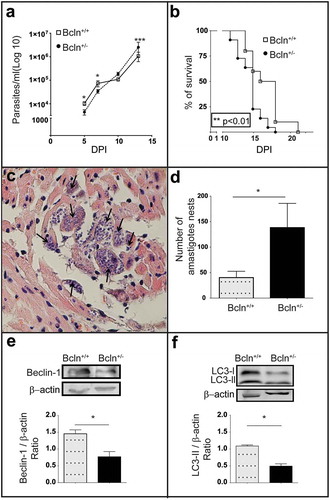
Figure 2. Inhibition of autophagy increases T. cruzi infection in Bcln+/+ mice. C57BL/6J wild type mice (Bcln+/+) were treated with CQ (10 mg/Kg/day) and DFMO (1 mg/g/day) for two days before infection and throughout the experiment as described in materials and methods. (a and e): Parasitemia curves obtained from these animals in comparison with non-treated Bcln+/+ mice. Data were obtained from three independent experiments of at least 4 mice each (Mann-Whitney test, * p < 0.05). (b and f): Survival analysis. Data were obtained from three independent experiments of at least 4 mice each (Log rank Mantel-Cox test) (c and g): Number of amastigotes in cardiac tissue from control and treated mice. Data were obtained from two independent experiments of at least 4 mice each (Mann-Whitney test, * p < 0.05). (d and h): Representative images showing the expression of LC3 forms in the liver of non-infected control or treated Bcln+/+ mice by western blot. Graphics show the OD of LC3-II relative to tubulin expression. Bars indicate the mean ± the standard error of two independent experiments of at least 2 mice each (Student´s t-test, *** p < 0.001).
Figure 3. Inhibition of autophagy increases T. cruzi infection in peritoneal cells. Peritoneal cells were isolated by lavage of the peritoneal cavity of Bcln+/+ or Bcln± mice and then infected with T. cruzi (MOI = 10) for 24 h before fixation. Samples, were then stained with TRITC-phalloidin and Hoechst and processed by confocal microscopy (see details in materials and methods). Other samples from Bcln+/+ mice were treated with 20 μM CQ or 10 mM DFMO from 2 h before and during infection and then processed as above. (a): Scheme of the infection protocol. (b): Representative images depicting the level of cellular infection under the indicated conditions. Parasites were visualized in green, actin cytoskeleton in red and the nuclei in blue. Bars: 5 µm. (c): Percentage of infected cells in the indicated conditions. Bars indicate the mean ± the standard error of at least three independent experiments. Number of counted cells: 100 to 300 cells each experiment (Dunnet test, * p < 0.05; ** p < 0.01).
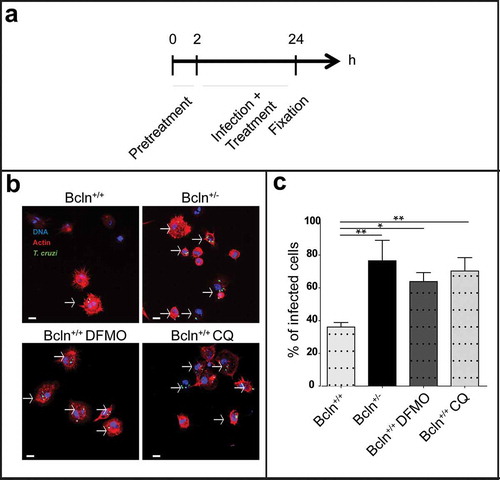
Figure 4. Autophagy participates in the control of T. cruzi infection by macrophages. RAW macrophages were infected for 24 h, washed and fixed or incubated for 24 or 48 h more before fixation. Fixed samples were then processed for microscopy (see details in materials and methods). Other samples were treated with 10 mM DFMO or 20 μM CQ for 2 h before infection (pre-treatment) and maintained in the same conditions during infection and chase periods followed by fixation and processing. (a): Scheme of the protocol. (b): Percentage of macrophages infected at progressive times in control conditions. Bars indicate the mean ± the standard error of at least four independent experiments. Number of counted cells: 100 (Tukey test, *p < 0.05; **p < 0.01). (c): Representative images depicting the level of cellular infection at 24 h under the indicated conditions. Parasites were visualized in green, actin cytoskeleton in red and the nuclei in blue. Bars: 5 μm. (d): Percentage of infected cells in the absence (control) or the presence of the autophagic inhibitors DFMO or CQ at each indicated time. Bars indicate the mean ± the standard error of at least three independent experiments. Number of counted cells: 100 to 300 cells each experiment (Tukey test, * p < 0.05; **p < 0.01; ***p < 0.001).
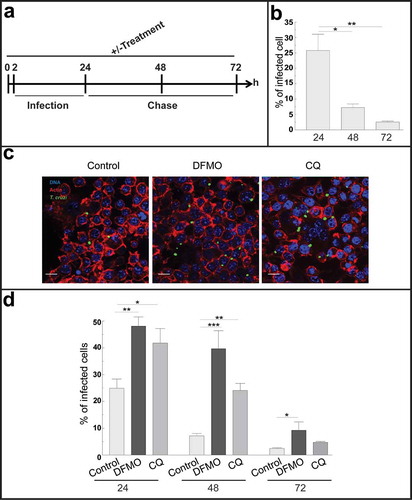
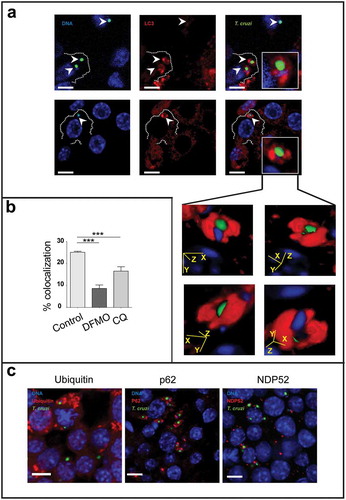
Figure 5. Macrophages eliminate intracellular parasites by xenophagy. RAW macrophages were infected for 24 h, washed and incubated for an additional period of 24 h in control medium or in the presence of 20 μM CQ or 1 mM DFMO before fixation. Fixed cells were then processed to detect LC3, ubiquitin, p62 or NDP52 by indirect immunofluorescence (see details in materials and methods). (a): Images depicting intracellular parasites (visualized in green and blue) surrounded by LC3 protein (in red). Insets show LC3 position of four different stacks of an amastigote. Bars: 5 µm. (b): Percentage of parasites surrounded by LC3 at different conditions. Bars indicate the mean ± the standard error of at least three independent experiments. Number of counted cells: 100 to 300 cells each experiment (Dunnet test, ***p < 0.001). (c): Images depicting different autophagy/xenophagy markers (in red) recruited to T. cruzi amastigotes (in green and blue).