Figures & data
Figure 1. Analysis of streptococcal aggregation. (a) S. canis strain G2 (SCM−) and G361 (SCM+) were grown overnight at 37°C in TSB. The photograph shows bacterial sedimentation. (b) Quantification of the sedimentation rate of the bacterial cultures shown in (a) by measuring the optical density at 600 nm at the indicated time points. The results present mean and standard deviation of a representative experiment done in triplicates. The experiments were repeated three times. (c) S. canis strain G361 wildtype (G361) and the isogenic scm-targeted insertional mutant (G361∆scm) were grown overnight at 37°C in TSB. The photograph shows bacterial sedimentation. (d) Quantification of the sedimentation rate of the bacterial cultures shown in (c) by measuring the optical density at 600 nm at the indicated time points. The results present mean and standard deviation of a representative experiment done in triplicates. The experiments were repeated three times.
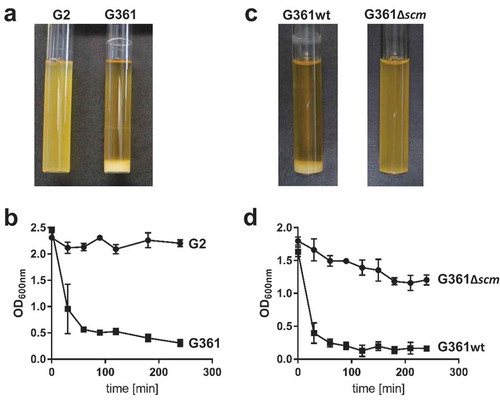
Figure 2. Microscopic analysis of streptococcal aggregation. (a) Scanning electron microscopic visualization of S. canis strain G2 and G361 from overnight cultures demonstrating bacterial aggregation of the SCM+ strain G361. Scale bars represent 10 µm left column and 5 µm right column. (b) Confocal microscopic analysis of bacterial aggregation and IgG binding. S. canis strain G361 and G2 were grown overnight at 37°C in TSB. Bacteria were allowed to adhere to poly-L-lysin-coated ibidi-slides, fixed and incubated with Alexa-488-conjugated rabbit (rb) IgG (cyan). Bacterial DNA/RNA was stained with ethidium homodimer-1 (red). Bacterial aggregation was visualized by confocal microscopy. Representative maximum intensity projections of deconvolved confocal z-stacks from 2 independent experiments are shown. Scale bar represents 10 µm. (c) Scanning electron microscopic visualization of S. canis strain G361wt and G361∆scm from overnight cultures demonstrating bacterial aggregation of the SCM+ strain G361wt. Scale bars represent 10 µm left column and 1 µm right column. (d) Confocal microscopic analysis of bacterial aggregation and IgG binding. S. canis strain G361wt and G361∆scm from overnight cultures generated and stained as described in (b). Alexa-488-conjugated rabbit (rb) IgG is shown in cyan and bacterial DNA/RNA stained with ethidium homodimer-1 is shown in red. Representative maximum intensity projections of deconvolved confocal z-stacks from 2 independent experiments are shown. Scale bar represents 10 µm.
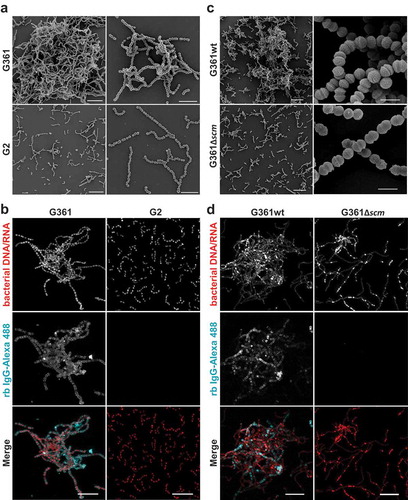
Figure 3. SCM interacts with itself via its N-terminus. (a) The SCM+ S. canis strain G361 was incubated with iodinated full-length SCM either without (w/o) or with pre-incubation with 1 µM non-iodinated SCM, N-225 or C-226, respectively. (b) S. canis G 361 was co-incubated with iodinated SCM and its derivatives C-226 and N-225, respectively. Results are depicted as mean and SD of percentage binding of totally used iodinated protein. (c) Interactions of soluble SCM-WT and its truncated fragments KO173225, N-225 and C-226, respectively, with immobilized SCM-WT were analyzed by surface plasmon resonance spectroscopy. Representative sensorgrams of three independent experiments show a dose-dependent binding of SCM-WT, KO173225 and N-225. No binding was observed for the C-terminal fragment C-226. The association and dissociation was observed, each of 300 s. Values of the control flow cells were subtracted from each sensorgram. The KD value is indicated for the interaction between SCM and SCM. A representative KD value was calculated for the interaction between N-225 and SCM.
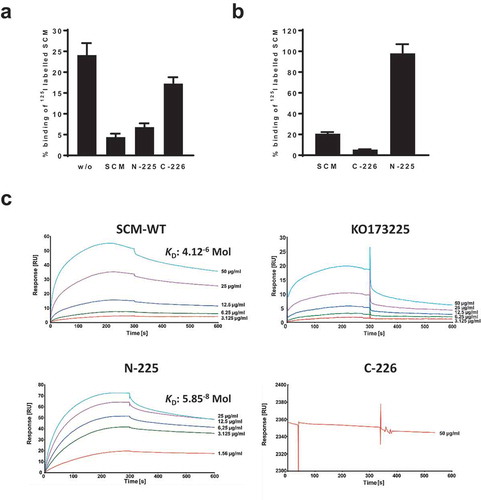
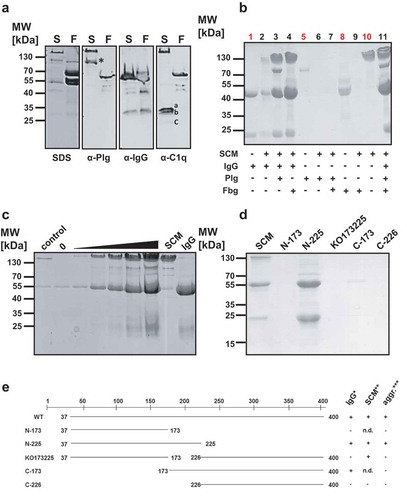
Figure 4. SCM-mediated complex formation is IgG-dependent. (a) Recombinant full-length SCM protein from strain G361 was added to human plasma (1:10 diluted) and incubated for 4 h at 37°C. After precipitation, protein aggregates were carefully washed with PBS, resuspended in Laemmli buffer and separated on a 10% SDS gel (SDS) or blotted onto a PVDF membrane and applied for western blot analysis using antibodies directed against plasminogen (α-Plg), IgG (α-IgG), and C1q (α-C1q). The three subunits of C1q (a, b, c) are indicated. (b) Recombinant WT-SCM was co-incubated with different host proteins alone or in combination and tested for complex formation (black numbers). Human IgG (1), plasminogen (5), fibrinogen (8) and recombinant SCM (10) served as protein quality controls (red numbers). (c) Increasing amounts of recombinant SCM protein (1 µg – 80 µg) were co-incubated with 20 µg human IgG. The resulting protein aggregates were analysed by SDS-PAGE. 20 µg of the truncated SCM fragment lacking the IgG binding region (KO173225) served as a control. 0, 20 µg IgG was incubated without SCM supplementation. (d) Recombinant full-length protein SCM and its derivatives N-173, N-225, KO173225, C-173 and C-226, respectively, were incubated with 1:10-diluted human plasma. Complex formation was monitored qualitatively by SDS-PAGE. (e) Schematic representation of the truncated fragments used in this study and their ability to bind IgG, SCM and to induce complex formation.