Figures & data
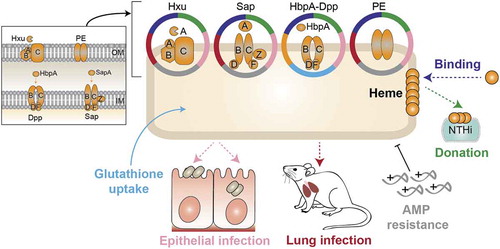
Figure 1. Schematic representation of NTHi heme uptake systems considered in this study. HxuCBA is a TonB-dependent system involved in heme-hemopexin binding. HxuC is a receptor and HxuAB is a two-partner secretion system. HxuA is exposed at the cell surface, and leads to heme release and its capture by HxuC. SapABCDFZ, HbpA-DppBCDF and PE are TonB-independent systems. SapA and HbpA are periplasmic proteins that bind heme and are linked to the inner membrane ABC transporters SapBCDFZ and DppBCDF, respectively. PE is an outer membrane protein that binds heme as a dimer. The HitABC free iron uptake system is also shown. HitA is a periplasmic protein that binds free iron linked to the HitBC transporter located at the inner membrane. Heme-iron sources are color-coded.
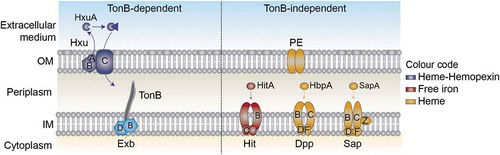
Table 1. Bacterial strains used in this study.
Figure 2. Structural prediction of heme binding to HbpA and SapA. HADDOCK was used to dock heme B to homology models of HbpA (green), full-length SapA (grey) and truncated SapA (purple) in which a non-conserved loop consisting of residues 140–158 has been removed. The truncated residues are colored orange in full-length SapA. (a) Overlay of the best scoring docking solutions for HbpA, SapA and truncated SapA. (b) Zoom-in on predicted heme binding sites showing how HbpA binds heme deeper into the ligand-binding pocket. In full-length SapA, the non-conserved loop (orange) prevents heme binding into the same pocket whereas in truncated SapA, the pocket is more accessible. (c-e) LigPlot+ analysis of the predicted heme binding site in HbpA (c), full-length SapA (d) and truncated SapA (e) with residues lining the binding sites in stick representation. Predicted hydrogen bonds are showed as dashed lines. Residues that are common for all three binding sites are colored yellow.
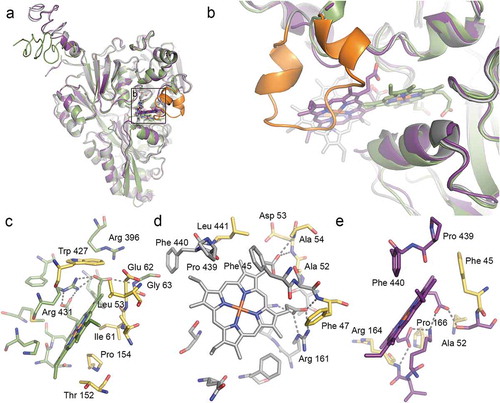
Figure 3. Expression of NTHi heme acquisition systems. (a) Expression of the hxuA, sapA, hbpA and hpe genes in NTHi375 WT, ΔhxuCBA, ΔsapA, ΔhbpA, and Δhpe strains grown in sBHI. Expression of the hbpA gene was higher than that of hxuA, sapA, and hpe (WT strain, higher expression of hbpA than that of hxuA (p < 0.05), sapA and hpe (p < 0.01); NTHi375ΔhxuCBA, higher expression of hbpA than that of sapA and hpe (p < 0.0005); NTHi375ΔsapA, higher expression of hbpA than that of hxuA and hpe (p < 0.0005); NTHi375Δhpe, higher expression of hbpA than that of hxuA (p < 0.05) and sapA (p < 0.0005)). Expression of the hxuA and hpe genes was higher in NTHi375ΔhbpA than in the WT strain (p < 0.0001 and p < 0.01, respectively). Bottom panel: schematic representation of each gene expression compared to each other, in the WT and mutant strains. Color code: blue, statistically significant differences; gray, not determined; white, no significant differences. Data are shown as mean ± SEM. Statistical comparisons of the means were performed with two-way ANOVA (Tukey´s multiple comparisons test). (b) Gene expression and heme sensing. In NTHi375 WT, ΔhbpA and Δhpe strains, hxuA, sapA, and hpe gene expression was higher in heme-restricted medium than in sBHI (WT: hxuA (p < 0.001), sapA (p < 0.01), hpe (p < 0.001); NTHi375ΔhbpA: hxuA (p < 0.01), sapA (p < 0.05), hpe (p < 0.0001); NTHi375Δhpe, hxuA, p < 0.05). In NTHi375 WT, ΔsapA and Δhpe strains, expression of hbpA was lower upon heme depletion (WT, p < 0.0001; NTHi375ΔsapA, (p < 0.001); NTHi375Δhpe, p < 0.05). Data are shown as mean ± SEM. Statistical comparisons of the means were performed with two-way ANOVA (Sidak´s multiple comparisons test).
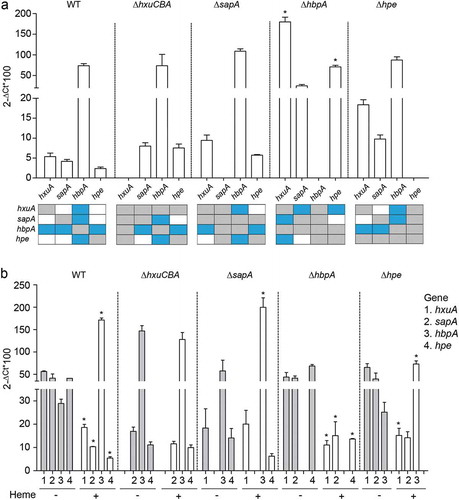
Figure 4. HxuCBA, SapA and HbpA participate in heme inter-bacterial donation. (a) Heme-starved NTHi 3655luxABCDE was used as a heme-recipient strain. Heme donation allowed recipient´s growth, measured as a means of luminescence. NTHi 3655luxABCDE co-culture with Hi RdKW20 WT rendered significant recipient growth, comparable to that of NTHi 3655luxABCDE grown in sBHI; in contrast, NTHi 3655luxABCDE co-culture with ΔhxuCBA, ΔsapA or ΔhbpA, did not promote recipient strain growth at the same extent (see growth time points 4, 5 and 6 h). HitABC does not contribute to surface-bound heme inter-bacterial donation. NTHi 3655luxABCDE co-culture with both Hi RdKW20 WT and ∆hitBC rendered significant recipient growth. White symbols, controls showing recipient strain growth in sBHI (square) or BHI-NAD (circle). Black symbols, recipient strain growth when co-cultured with WT (square) or mutant (circle) strains. *Indicates significant differences when comparing luminescence upon recipient co-culture with WT (square) or mutant (circle) strains. Data are shown as luminescence arbitrary units (AU) and represent mean ± SEM values. Statistical comparisons of the means were performed with two-way ANOVA (Bonferroni multiple comparisons test). (b) Semi-quantitative measure of heme binding on the surface of Hi RdKW20 WT and mutant strains. Normalized bacterial suspensions were 2-fold serially diluted (OD600 = 0.1 and 0.05) and spotted on a PVDF filter. ECL was used for heme detection. Blots are representative images of at least three independent experiments.
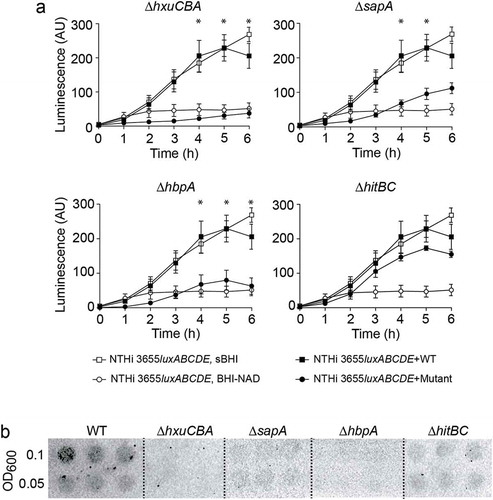
Figure 5. Moonlighting features of NTHi heme acquisition systems. (a) HxuCBA, SapABCDFZ and PE are involved in NTHi resistance to PxE. MIC for PxE was shown to be lower for ΔhxuCBA, ΔsapA and Δhpe mutants than for the WT strain. Inactivation of the hbpA gene rendered higher MIC for PxE. Bacterial inocula were prepared on heme-deficient or sBHI media. (b) HbpA, but not HxuCBA, SapABCDFZ or PE, participates in glutathione import by NTHi. Bacteria were grown in CDMM supplemented with cystine or GSSG. CDMM+cystine sustained bacterial growth in all cases. NTHi375ΔhbpA growth was lower in CDMM+GSSG than in CDMM+cystine (at 2.5 h, p < 0.05; 3 h, p < 0.001; from 3.5 to 8 h p < 0.0001). Data are shown as mean ± SEM. Statistical comparisons of the means were performed using two-way ANOVA (Tukey´s multiple comparisons test).
Figure 6. NTHi heme acquisition systems contribute to the host airway-pathogen interplay. (a) Effect of heme uptake inactivation in NTHi interplay with cultured cells. A549 cells were used to quantify invasion by NTHi375 WT, ΔhxuCBA, ΔsapA, ΔhbpA and Δhpe strains. Gene inactivation rendered significantly lower entry into A549 cells than that shown by the WT strain (ΔhxuCBA, p < 0.05; ΔsapA and Δhpe, p < 0.0001; ΔhbpA, p < 0.001). Mean ± SEM values are shown, statistical comparisons of the means were performed using one-way ANOVA (Dunnett’s multiple comparison test). (b) Inactivation of heme-binding systems lowers NTHi interaction with airway epithelial cells in a heme-dependent manner. BHI-NAD (gray bars) and sBHI (white bars) led to decreased A549 invasion rates for the mutants, compared to that of the WT strain (p < 0.0001). Bacterial growth in sBHI increased invasion rates, compared to BHI-NAD (for WT, ΔhxuCBA, ΔsapA and Δhpe, p < 0.0001). Top numbers indicate invasion fold increase for each strain upon growth in sBHI compared to BHI-NAD. Mean ± SEM values are shown, statistical comparisons of the means were performed using two-way ANOVA (Sidak’s multiple comparison test). (c) Effect of heme uptake inactivation in NTHi pulmonary infection. CD1 mice were intranasally infected with WT and mutant strains, euthanized at 24 and 48 hpi, and bacterial loads quantified. Results are reported as log10 CFU/lung and log10 CFU/ml BALF in upper and lower panels, respectively, and represented as box plot graphs (lines inside boxes represent median values). Statistical comparisons were performed using one-way ANOVA (Dunnett’s multiple comparison test). In the lungs, NTHi375ΔhxuCBA showed significantly lower loads at 24 hpi (ΔhxuCBA, p < 0.0005), and all mutants showed significantly lower loads at 48 hpi (ΔhxuCBA, ΔsapA, p < 0.0001; ΔhbpA, p < 0.001; Δhpe, p < 0.05) than those shown by the WT strain. In BALF samples, NTHi375ΔhxuCBA showed significantly lower loads at 24 hpi (p < 0.0001), and all mutants showed significantly lower loads at 48 hpi (ΔhxuCBA, p < 0.05; Δhpe, p < 0.01; ΔsapA and ΔhbpA p < 0.005) than those shown by the WT strain.
Figure 7. Schematic model showing moonlighting patterns by HxuCBA, SapABCDFZ, HbpA-DppBCDF and PE heme acquisition systems.