Figures & data
Table 1. The characteristic of clinical uropathogenic E. coli strains selected for the study; 0 – lack of the gene, 1 – gene presence, S – sensitive, I – intermediately sensitive. CIP – ciprofloxacin, NOR – norfloxacin, OFX – ofloxacin, AML – amoxicillin, AMC – amoxicillin/clavulanate, PRL – piperacillin, CAZ – ceftazidime, FOX – cefoxitin, CTX – cefotaxime, IMI – imipenem, GN – gentamycin, TN – tobramycin, AK – amikacin, NET – netilmicin, NI – nitrofurantoin, W – trimethoprim, SXT – trimethoprim/sulfamethoxazole.
Figure 1. The schematic description of the E. coli derivatives selection using Method I and Method II described in the Materials and Methods.
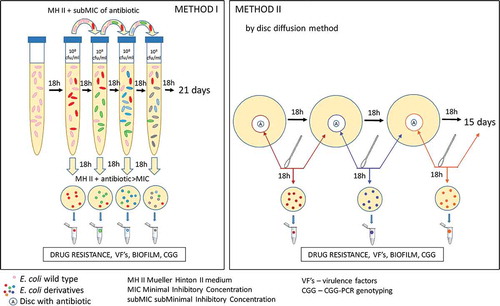
Table 2. Oligonucleotides used in the study.
Table 3. The rate of derivatives and drug-resistance generation. The day of the 1st derivative appearance was confirmed according to developed method I for CIP and AML and method II for GN and TN, described in the Materials and Methods. The day of the first resistance of particular derivatives was confirmed via the disc diffusion method. The total number of all selected derivatives represents the strains expressing antibiotic-tolerance >MIC of ciprofloxacin (CIP), amoxicillin (AML), gentamycin (GN), or tobramycin (TN).
Table 4. Heat map of the percentage of E. coli derivatives with acquired resistance to particular antibiotics. I – Fluoroquinolones, II – Penicillins, III – Cephalosporins, IV – Carbapenems, V – Aminoglycosides, VI – Others, CIP – ciprofloxacin, NOR – norfloxacin, OFX – ofloxacin, AML – amoxicillin, AMC – amoxicillin/clavulanate, PRL – piperacillin, CAZ – ceftazidime, FOX – cefoxitin, CTX – cefotaxime, IMI – imipenem, GN – gentamycin, TN – tobramycin, AK – amikacin, NET – netilmicin, NI – nitrofurantoin, W – trimethoprim, SXT – trimethoprim/sulfamethoxazole, NT – not tested, Avg – average of percentage of E. coli derivatives with acquired resistance to all antibiotics.
Figure 2. The relative antibiotic sensitivity (SRel) of wild-type E. coli strains (No. 1, No. 5, No. 6, No. 16, and No. 84) and their derivatives isolated during the treatment with a subinhibitory concentration of antibiotics (ciprofloxacin, amoxicillin, gentamycin, and tobramycin). The sensitivity was measured for all studied antibiotics (CIP – ciprofloxacin, NOR – norfloxacin, OFX – ofloxacin, AML – amoxicillin, AMC – amoxicillin/clavulanate, PRL – piperacillin, CAZ – ceftazidime, FOX – cefoxitin, CTX – cefotaxime, IMI – imipenem, GN – gentamycin, TN – tobramycin, AK – amikacin, NET – netilmicin, NI – nitrofurantoin, W – trimethoprim, SXT – trimethoprim/sulfamethoxazole). The results (SRel) represent the ratio between the medium value of diameter zone of inhibited growth of E. coli strains (wild type or derivatives) and the limit value of the sensitivity diameter zone according to the clinical breakpoint tables from EUCAST 2018. The value 1 on the Y axis means the limit value of the diameter zone of inhibited bacterial growth corresponding to sensitivity according to the clinical breakpoint tables of EUCAST 2018. The statistically significant (p < 0.05)* difference between the sensitivity to individual antibiotics was determined using a two-tailed, paired T-test (GraphPad Prism, version 6; San Diego, CA, USA), ns – not statistically significant.
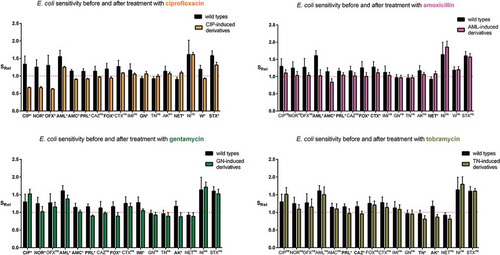
Table 5. The stability of acquired resistance among derivatives of E. coli strains. After the 1st, 4th, 8th, 12th, and 19th day of passage of derivatives the antibiotic resistance was verified by disc diffusion method. High stability – 100% of derivatives remained resistant; *85% of derivatives remained resistant; diverse stability – the resistance profiles of the derivatives were diverse after the resistance stability assay; instability – 100% of derivatives lost the drug resistance.
Figure 3. The examples of growth curves of the wild type (E. coli No. 5, negative control) and its derivative (E. coli No. 5/12CIP) upon treatment with the sub-MIC of antibiotics (amoxicillin or ciprofloxacin). The positive control of logarithmic growth curve was E. coli ATCC 25,922 incubated in optimal conditions. The absorbance level of the growth (A600) was measured every two hours. Each bar represents the mean with standard deviation, all measurements were performed in two independent experiments.
Table 6. The occurrence of virulence factor genes (papC, sfaD/E, cnf1, usp, fimG/H, and hlyA) in ciprofloxacin-induced E. coli derivatives and their wild type E. coli strains; 0 – lack of the gene, 1 – gene presence. The lack or presence of particular genes was consistent with no or active expression on the transcriptional level.
Figure 4. The examples of agarose gel electrophoresis for PCR products of sfaD/E (A, B), cnf1 (C), and fimG/H (D) gene fragments amplified from cDNA synthesized by reverse transcription of mRNA isolated from E. coli wild type (No. 6 and No. 16) and ciprofloxacin-resistant derivatives (No.: 6/1C, 6/4C, 6/7C, 6/10C, 6/12C, 6/16C, 6/20C, 16/1C, 16/4C, 16/7C, 16/10C, 16/12C, 16/16C, and 16/20C), M – 100 bp DNA Ladder (Invitrogen).
Figure 5. The comparison of the biofilm formation between the wild types and derivatives (amoxicillin-induced) of E. coli strains No. 5 and No. 6. Each bar represents the mean with standard deviation based on the OD value of the absorbed crystal violet (0,3%) measured at 531 nm (A531) for each strain from particular groups (wild types and derivatives). The study was performed in four replications in two independent experiments. The difference is significant (p < 0.05, unpaired T-test, two-tailed, nonparametric).
Figure 6. The relative biofilm formation of the wild type and derivatives (amoxicillin-induced) of E. coli strain No 5. (A) and No. 6 (B). The biofilm was analyzed based on the OD value of the absorbed crystal violet (0,3%) measured at 531 nm (A531). The results represent the values of relative biofilm formation (BRel) independent of bacterial growth (A531/A600). The study was performed in four replications, in two independent experiments.
Figure 7. The stability of biofilm formation of the amoxicillin-induced derivatives of E. coli No. 5 and No. 6. The biofilm formation was measured after the subsequent days of culture passages under the control condition (without antibiotic). The biofilm was analyzed based on the OD value of the absorbed crystal violet (0.3%) measured at 531 nm (A531). The results represent the values of relative biofilm formation (Brel) independent of bacterial growth (A531/A600). The study was performed in four replications in two independent experiments.
Figure 8. The comparison of the fingerprint profiles of the CGG-PCR products amplified from E. coli wild type (No. 1, No. 5, No. 6, No. 16, and No. 84) and their antibiotic-induced derivatives (exemplary pictures): C – ciprofloxacin-induced E. coli derivatives, A – amoxicillin-induced E. coli derivatives, GN – gentamycin-induced E. coli derivatives, TN – tobramycin-induced E. coli derivatives. The external DNA band patterns – 100 bp DNA Ladder (Invitrogen).