Figures & data
Figure 1. S. Typhimurium CVCC541 and CMCC50115 strains are less virulent strains compared to SL1344 strains. C57BL/6 mice were infected intravenously with S. Typhimurium CVCC541, CMCC50115 and SL1344 strain (2.5 × 10⁵ CFU) for the indicated days. (a) Survival rate of C57BL/6 mice. (b) Body weight of mice infected by three S. Typhimurium strains. (c) Cytokine levels of TNF-α, IL-6, IL-1β in serum of mice by ELISA (n = 4). (d, e) Gross anatomy of spleen (d) and liver (e). (f) Bacterial loads in spleen and liver (n = 3). (g) Hematoxylin and eosin-stained spleen, liver, and intestine sections (Scale bar = 100 μm) of mice at 3 days and 11 days post infection (*p < 0.05, **p < 0.01).
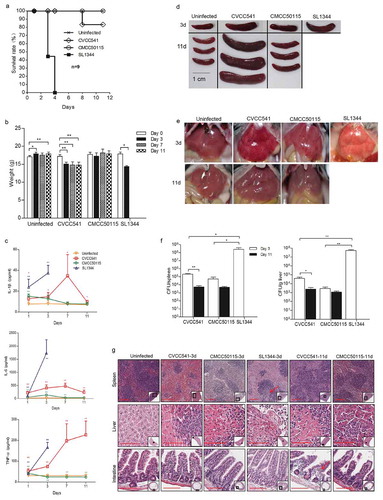
Figure 2. S. Typhimurium CVCC541 and CMCC50115 strains induced innate immunity of mice. C57BL/6 mice were infected intravenously by S. Typhimurium CVCC541, CMCC50115, and SL1344 strain, respectively, and killed at 3 days after infection. (a) Flow cytometry of macrophages (F4/80+CD11b+) and neutrophils (Ly6G+CD11b+) in the spleens of mice infected by S. Typhimurium. (b) Quantification of positive cells (n = 3). (c) The detection F4/80+ and TUNEL+ in frozen sections of spleens (red, anti-F4/80; green, TUNEL; blue, Hoechest33342), Scale bar = 20 μm. (d) Quantification of TUNEL+ cells per area F4/80+ splenic tissue. (e) Immunoblot analysis of cleaved caspase3 in spleens. (f) Quantification of total densitometry of 17KD and 19KD (n = 3). (g) Immunoblot analysis of cytokine secretion in splenic cells (TNF-α, IL-6, IL-1β,iNOS) at 3 days after infection. (h) Quantification of relative densitometry (The fold change = the densitometry of bands in indicated S. Typhimurium infected mice relative to uninfected mice) (n = 3). (i) The expression of nitric oxide (NO) in spleen homogenates at 3 days. (*p < 0.05, **p < 0.01).
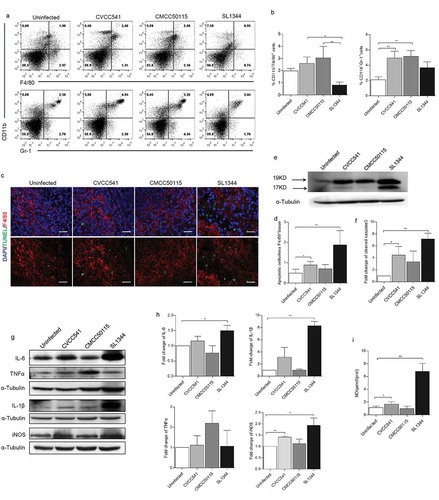
Figure 3. S. Typhimurium CVCC541 primed the proliferation and activation of T cells. Mice were infected intravenously by S. Typhimurium CVCC541 and CMCC50115 and killed after 11 days of infection. (a-d) The expression of nuclear protein Ki67 in CD4+ T cells (a, b) and CD8+ T cells (c, d). (e-h) The percentage of CD44hiCD62Llo cells in CD4+ T cells (e, f) and CD8+ T cells (g, h) (n = 4) (*p < 0.05, **p < 0.01).
Figure 4. S. Typhimurium CVCC541 enhanced the recruitment and stimulation of dendritic cells and macrophages in the spleen at 11 days after infection. (a, b) The percentages of dendritic cells (CD11c+MHCII+) in the spleen. (c, d) The mean fluorescence intensity of MHCII in CD11c+ splenic cells. (e, f) The frequency of macrophages (F4/80+CD11b+) of spleens (n = 3). (g) The analysis of costimulator CD80 and CD86 in spleen by Western Blot (n = 3). (h) The staining of F4/80 and TUNEL in frozen splenic sections (red, anti-F4/80; green, TUNEL; blue, Hoechest33342), scale bar = 20 μm (*p < 0.05, **p < 0.01).
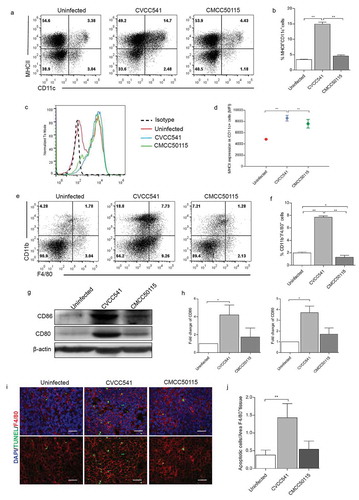
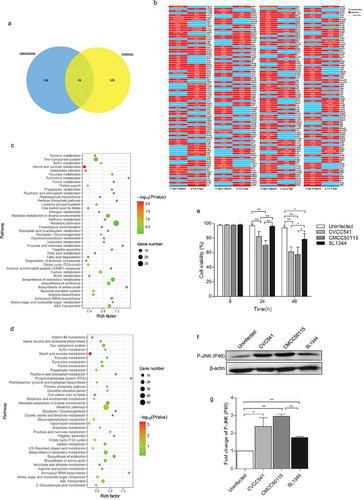
Figure 5. The genomic differences among S. Typhimurium CVCC541, CMCC50115 and SL1344 strains. The genomes of CVCC541 and CMCC50115 were analyzed when the genome of SL1344 strain was regarded as the reference sequences. (a) The number of unique and shared mutant protein-coding genes between S. Typhimurium CVCC541 and CMCC50115. (b) The mutant sites of all mutant genes were listed (Red box, mutagenesis; Blue box, no mutation). (c, d) Partial metabolic pathway involving mutant protein-coding genes in CVCC541 (c) and CMCC50115 (d). (e) Viability of IEC cells infected by different S. Typhimurium strains by measuring lactate dehydrogenase (LDH) activity. (f) Immunoblotting analysis of p-JNK in IEC-6 cells infected with S. Typhimurium strains. (g) The quantification of relative densitometry from (f) at 46KDa (*p < 0.05, **p < 0.01).