
Figures & data
Figure 1. Two heatmaps that visualize the proteome differences in exoproteins of the four genotypes. a) Heatmap generated after the missing values were replaced by the constant “0.” The presentation demonstrates that the number of proteins was not detected in all 7 biological replicates (denoted with a–g) within the genotype. b) Heatmap was generated after the missing values were replaced from a normal distribution, and the data were subtracted using a Z-score. Both data evaluation methods provide similar results in which ERIC I clusters separately from ERICs II–IV, which likely corresponds to the difference in the efficiency at which these genotypes kill honeybee larva. Overall, the results indicate a similarity between ERIC III and IV and a substantial difference between ERIC I and II.
Figure 2. Two PCA charts that illustrate the proteome differences in exoproteins of the four genotypes. Each of the symbols represents one biological replicate, and the analysis clearly demonstrates the homogeneity of the samples or analyses. The same numerals used to generate the heatmaps in and were used to produce the charts in Figures 2(a,b), respectively. The similarity in ERIC III and IV and separate positions of ERIC II and ERIC I are clearly demonstrated.
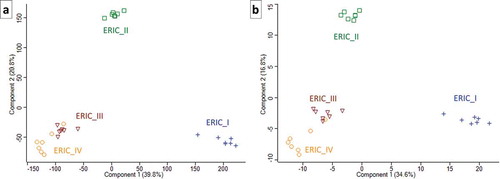
Table 1. Selected proteins represent the major known or novel candidate protein-derived virulence factors of the P. larvae ERIC I–IV genotypes. The relative mean of log2-transformed protein abundance is provided, and the white square indicates that the protein was not detected. The first UniProt protein ID (as listed in Table S1), curated protein name, description and conserved domains for the proteins are also provided. The abbreviation s.f. indicates superfamily. For the lists of UniProt protein IDs and next potential markers, see the Excel file Table S1.