Figures & data
Figure 1. Radial growth of cryptic species within section Terrei differs depending on medium and incubation temperature. Box and whisker blots represent the median ± maximum/minimum colony diameter of strains grown on ACM (black boxes) and RPMI1640 (grey boxes), respectively, at 25°C (a), 30°C (b), 37°C (c) and 42°C (d) for 48 h. Stars below boxes indicate significant difference between ACM and RPMI1640 medium (p < 0.05; 2 Way ANOVA, Sidak´s multiple comparison). Grey stars above boxes indicate significant difference in the median colony diameter between the species (p < 0.05; 2 Way ANOVA, Tukey´s multiple comparison).
Table 1. Radial growth of Terrei under hypoxic and normoxic conditions. Fungi were grown on ACM at 37°C and colony diameters were determined at 48 h and 72 h. Average was calculated from colony diameters of three biological replicates of all strains of the respective species. Growth reduction presents relative growth reduction of cultures grown in hypoxia. For A. neoafricanus average was calculated from repeated results of the same strain, indicated by *.
Table 2. Germination rates of Terrei. 105/ml phialidic conidia of each isolate were incubated in ACM and number of germinated cells evaluated microscopically. Germination rates express the percentage of conidia with germtube formation normalized to the total number of counted conidia (n = 100) after 8 h of incubation at 37°C and 30°C. Average germination rates and mean germination rate were calculated from data of three independent experiments of all strains tested per species.
Figure 2. Germination rates of accessory conidia (black bars) was compared to phialidic conidia (grey bars) for selected strains incubated at 37°C for 8 h. Bars represent average germination rate of three independent experiments. Error bars represent standard deviation. Significant differences in germination rates of accessory conidia from phialidic conidia are indicated by * (p < 0.0001, Sidak´s multiple comparison, unless otherwise indicated).
Figure 3. Survival rate of G. mellonella larvae 48 h after infection with 107 phialidic conidia of each isolate, respectively, and incubation at 30°C (a) and 37°C (b). Bars represent average survival rate of three independent experiments (60 larvae in total). Dotted horizontal line represents average survival rate of all 73 strains tested at 48 h (75% at 30°C and 41% at 37°C).
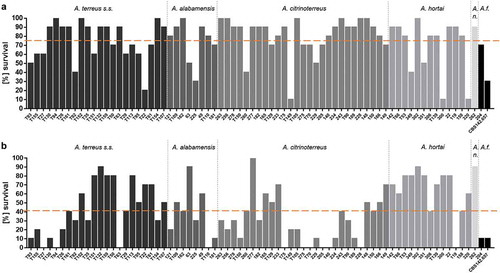
Figure 4. Average survival rates per species at 30°C (a) and 37°C (b). Average survival rates were calculated from all isolates per species, all three independent experiments. Average ALL represents the average survival rate of all 73 tested isolates. Kaplan-Meier curves were analyzed for significance by Log-Rank (Mantel Cox) test, resulting in no significant difference of any of the curves to the average survival rate of all 73 strains (p values are indicated).
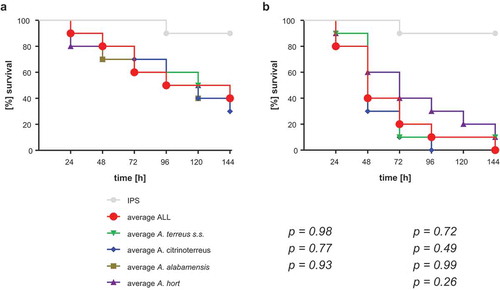
Figure 5. Virulence potential of accessory conidia versus phialidic conidia of selected strains. Larvae were infected with 106 conidia of the respective strain and incubated at 37°C for six days. Kaplan-Meyer curves represent average survival of three independent experiments (60 larvae in total). Accessory conidia of strain T154 and T24 caused significant lower survival rates than phialidic conidia (according to Log-Rank test (p < 0.05); indicated by*).
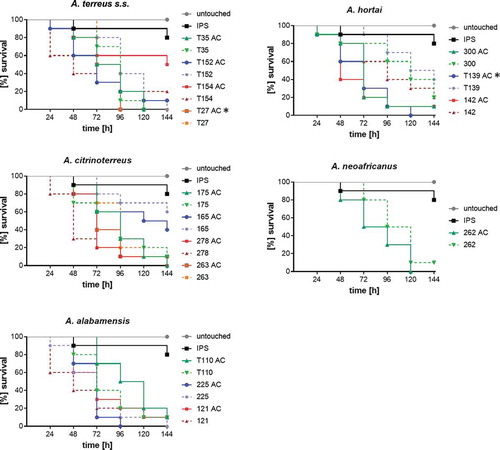
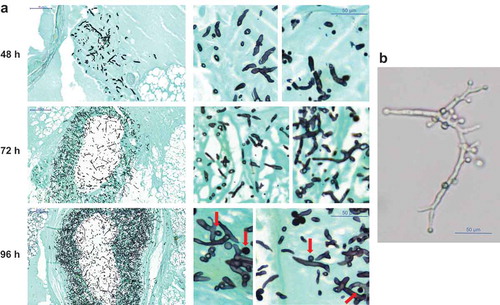
Figure 6. (a) Histopathology of G. mellonella larvae infected with 106 phialidic conidia of A. hortai 142. Larvae were infected, incubated at 37°C and sacrificed at the indicated time points. To simplify recognition of fungal elements samples were stained with Grocott´s silver stain. (b) Presence of AC on A. hortai 142 hyphae grown at 37°C in liquid Sabouraud medium for 5 days.