
Figures & data
Table 1. Bacterial strains and cell lines used in this study.
Figure 1. Quantitative analysis of viable intracellular corynebacteria and cytokine ELISA of bone marrow-derived murine macrophages from C57/BL6 (BMM), Clec4e- and MyD88-deficient mice after infection with bacteria. Cells were infected with C. diphtheriae wild type strains ISS3319, DSM43989 and C. glutamicum ATCC 13032 at an MOI of 10 for 2, 4 and 20 h, lysed and the lysates were plated on blood agar plates. (a) Intracellular CFU in percent of the inoculum. (b) intracellular survival in percent of the bacteria that were taken up after 2 h. Supernatants of primary bone marrow (BMM), Clec4e−/- and MyD88−/- macrophages infected with bacteria were collected at different time points post-infection (2, 4 and 20 h) and used for the determination of (c) G-CSF and (d) IL-6 concentrations. Data shown are mean values of at least three independent biological replicates each performed in triplicates ± standard deviation.
Figure 2. Quantitative analysis of viable intracellular corynebacteria in THP-1 cells and evaluation of cytokine and nitric oxide production. THP-1 cells were infected with different C. diphtheriae wild type strains and C. glutamicum ATCC 13032 at an MOI of 10 for 2, 4 and 20 h, lysed and the lysates were plated on blood agar plates. (a) Intracellular CFU in percent of the inoculum. (b) Intracellular survival in percent of the bacteria taken up after 2 h. Supernatants of THP-1 cells infected with bacteria were collected at different time points post-infection (2, 4 and 20 h) and used as samples for determination of (c) G-CSF and (d) IL-6 and (e) NO concentrations. Data shown are mean values of at least three independent biological replicates each performed in triplicates ± standard deviation.
Figure 3. NF-KB activation in response to C. diphtheriae infection. THP1-Blue NF-KB cells were incubated for 20 h with viable and UV-killed bacteria of the non-pathogenic C. glutamicum ATCC 13032 and pathogenic C. diphtheriae strains at an MOI 1 and 10, respectively. Subsequently, supernatants were taken and mixed with QuantiBlue SEAP detection solution leading to a change in color upon NF-KB activation, which was detected by measuring absorbance at 620 nm. Dead bacteria are indicated with (┴) and live bacteria with (*). Data shown are mean values of three independent biological replicates each performed in triplicates ± standard deviation.
Figure 4. LDH release of cells. The release of lactate dehydrogenase (LDH) as a sign of host cell damage during infection of THP1-Blue NF-KB cells with C. diphtheriae was measured using the cytotoxicity detection kit (Roche). Cells were infected for 20 h with viable and UV-killed bacteria of the non-pathogenic strain C. glutamicum ATCC 13032 and different pathogenic C. diphtheriae wild type strains at an MOI 1 and 10, respectively. Cytotoxicity was calculated based on the absorbance values at 492 and 620 nm. Viable bacteria are indicated with (*) and dead bacteria with (┴). Data shown are mean values of three independent biological replicates each performed in triplicates ± standard deviation.
Figure 5. TLR reporter assays. (a) TLR binding of C. diphtheriae in HEK-Blue 293 hTLR2 cells. HEK-Blue 293 hTLR2 cells were incubated for 24 h with viable and UV-killed bacteria of pathogenic C. diphtheriae and the non-pathogenic C. glutamicum ATCC 13032 at an MOI 1 and 10, respectively. Subsequently, supernatants were taken and mixed with QuantiBlue SEAP detection solution leading to color change upon TLR activation. (b) TLR binding of C. diphtheriae in HEK-Blue 293 hTLR9 cells. HEK-Blue 293 hTLR9 cells were incubated for 24 h with viable and UV-killed bacteria of pathogenic C. diphtheriae and the non-pathogenic C. glutamicum ATCC 13032 in HEK-Blue Detection medium at an MOI 10 and 50, respectively. In both cases, TLR binding was detected by measuring absorbance at 620 nm. Viable bacteria are indicated with (*) and dead bacteria with (┴). Data shown are mean values of three independent biological replicates each performed in triplicates ± standard deviation.
Table 2. Intracellular CFUs [%] of different corynebacteria in THP-1 cells.
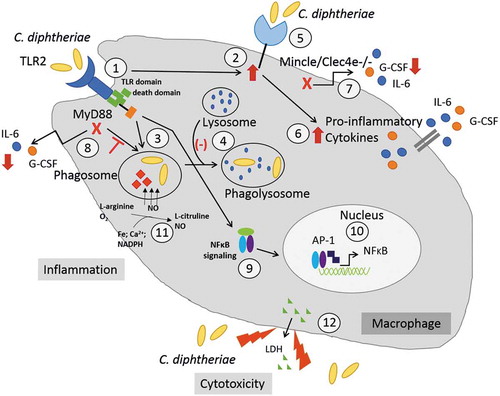
Figure 6. C. diphtheriae recognition by macrophages. Binding of C. diphtheriae by TLR2 (1) leads on the one hand to upregulation of the C-type lectin receptor Mincle (2) and on the other hand, to phagocytosis of the bacteria (3), resulting in phagosome-lysosome fusion, which is somehow delayed by C. diphtheriae (4). Furthermore, binding of C. diphtheriae to Mincle (5) triggers the production of pro-inflammatory cytokines (6), which was confirmed by reduced cytokine production in Clec4e−/- cells (7). Additionally, in Myd88-deficient cells the cytokine production as well as the uptake of the bacteria was completely blocked (8). Further signs of inflammation caused by pathogenic corynebacteria are the activation of NFκB-signaling (9), resulting in upregulation of pro-inflammatory genes (10), and the production of nitric oxide (NO) (11). In case of the infection of THP-1 cells, a cytotoxic effect of C. diphtheriae was detectable by LDH release (12).