Figures & data
Figure 1. Regions containing the five SPATE-encoding genes in E. coli QT598.
The tsh and sha genes are located on a ColV-type plasmid (pEC598). The vat, tagB, and tagC genes are located on genomic islands. Arrows indicate open reading frames (ORFs). SPATE encoding ORFs and regulatory gene vatX are in red. Predicted full amino acid lengths and GC content of the SPATE ORFs are indicated below arrows. Blue ORFs are related to insertion elements, integrases, or mobile elements. Dark green ORFs are predicted fimbrial proteins. Light green ORFS are predicted EAL-domain proteins. Grey ORFS are hypothetical uncharacterized ORFs. Orange ORFs are hypothetical regulatory proteins. Purple ORFs are genes conserved in E. coli K-12 that border the SPATE-encoding genomic regions. Direct repeats (DR) are indicated for the region containing the tag AT genes.
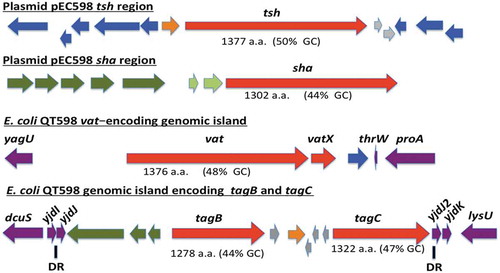
Figure 2. Phylogenetic analysis of new SPATEs identified in the QT598 genome.
The evolutionary history of passenger domains of QT598 SPATEs (highlighted in yellow) as well as other characterized SPATEs was inferred using the Neighbor-Joining method [Citation98]. The optimal tree with the sum of branch length = 8.78918031 is shown. The tree is drawn to scale, with branch lengths in the same units as those of the evolutionary distances used to infer the phylogenetic tree. The evolutionary distances were computed using the JTT matrix-based method [Citation99] and are in the units of the number of amino acid substitutions per site. The analysis involved 17 amino acid sequences. All positions containing gaps and missing data were eliminated. There were a total of 723 positions in the final dataset. Evolutionary analyses were conducted in MEGA6 [Citation85]. Multiple sequence alignment was performed by Clustal W, and the tree was constructed using the Mega6 software with PhyML/bootstrapping. A cluster of cytotoxic SPATEs (class 1) comprise the green branches, while immunomodulator SPATEs (class 2) are in blue branches. DNA regions encoding SPATE protein sequences are available in NCBI database as follows: EspC, GenBank Accession No. AAC44731, TagB and TagC, MH899681; EspP, NP_052685; SigA, AF200692; Pet, SJK83553; Sat, AAG30168; EatA, CAI79539, SepA, Z48219; Pic, ALT57188; Boa, AAW66606; EaaA, AAF63237; Sha, MH899684; Vat, MH899682; TleA, KF494347; Tsh/Hbp, MH899683.
![Figure 2. Phylogenetic analysis of new SPATEs identified in the QT598 genome.The evolutionary history of passenger domains of QT598 SPATEs (highlighted in yellow) as well as other characterized SPATEs was inferred using the Neighbor-Joining method [Citation98]. The optimal tree with the sum of branch length = 8.78918031 is shown. The tree is drawn to scale, with branch lengths in the same units as those of the evolutionary distances used to infer the phylogenetic tree. The evolutionary distances were computed using the JTT matrix-based method [Citation99] and are in the units of the number of amino acid substitutions per site. The analysis involved 17 amino acid sequences. All positions containing gaps and missing data were eliminated. There were a total of 723 positions in the final dataset. Evolutionary analyses were conducted in MEGA6 [Citation85]. Multiple sequence alignment was performed by Clustal W, and the tree was constructed using the Mega6 software with PhyML/bootstrapping. A cluster of cytotoxic SPATEs (class 1) comprise the green branches, while immunomodulator SPATEs (class 2) are in blue branches. DNA regions encoding SPATE protein sequences are available in NCBI database as follows: EspC, GenBank Accession No. AAC44731, TagB and TagC, MH899681; EspP, NP_052685; SigA, AF200692; Pet, SJK83553; Sat, AAG30168; EatA, CAI79539, SepA, Z48219; Pic, ALT57188; Boa, AAW66606; EaaA, AAF63237; Sha, MH899684; Vat, MH899682; TleA, KF494347; Tsh/Hbp, MH899683.](/cms/asset/350e1e33-04f8-4e17-88c6-4445b6a62589/kvir_a_1624102_f0002_oc.jpg)
Figure 3. Detection of SPATE proteins by SDS-PAGE A. SDS-PAGE analysis of cloned SPATE genes.
a. Clones expressing SPATE proteins were produced in the BL21 background with high-copy plasmid pBCsk+. Supernatants were filtered then concentrated through Amicon filters with 50 kDa cutoff. Samples containing 5 µg protein were migrated with protein marker (10–200 kDa) and stained with Coomassie blue (arrow represents 100 kDa size marker). b. Detection of SPATEs from supernatants of strain QT598 and various SPATE gene mutant derivatives. Supernatants from an overnight culture of the respective mutants were filtered, concentrated and run on SDS-polyacrylamide gels and stained with Coomassie blue to visualize proteins.
Figure 4. Oligopeptide cleavage profiles of SPATEs.
a. Enzymatic activity of cloned SPATEs. Five μg of each SPATE-containing supernatant was incubated at 37°C for 3 h with 1mM of synthetic oligopeptide specifically recognized by the following enzymatic activities: Elastase (Ela)-(N-Suc-Ala-Ala-Ala-pNA); Trypsin (Try)-(N-Ben-L-arginine-pNA); or Chymotrypsin (Chy)-(N-Suc-Ala-Ala-Pro-Phe-pNA). Absorbance at 410nm was normalized to the maximum absorbance value. b. Enzymatic activity of supernatants from strain QT598 and SPATE gene mutant derivatives. Samples were tested as described above. Data are the means of three independent experiments, and error bars represent the standard errors of the means (* p < 0.05, **p < 0.01, ***p < 0.001 one-way ANOVA with multiple comparisons vs pBCsk+ (A) or QT598Δ5ATs (B)).
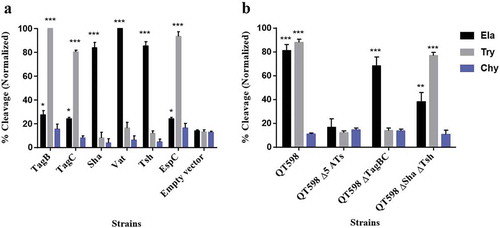
Figure 5. Stereo ribbon diagram showing the predicted three-dimensional structure of the Sha SPATE passenger domain derived from the Hbp/Tsh crystal structure.
Crystal structure of the Heme-binding protein (Hbp) (PDB 1WXR), which is near identical to Tsh, was used to model a homologous structure based on alignment with the Sha protein sequence. The model was generated using the I-TASSER server with 100.0% confidence by the single highest scoring template. Sha is shown to harbor a conserved domain, domain 2 (shown in pink), which is characteristic of class 2 SPATEs.
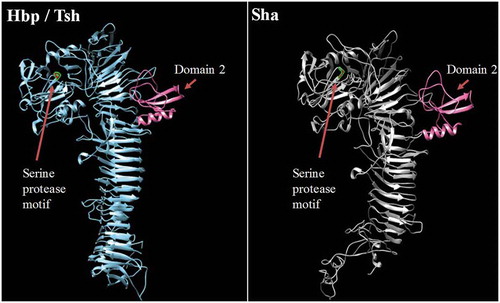
Figure 6. TagB, TagC, and Sha SPATEs promote adherence to the human kidney (HEK-293) and bladder (5637) epithelial, and avian fibroblast (CEC-32) cell lines.
Cell monolayers were infected with E. coli fim-negative ORN172 expressing SPATE proteins at a multiplicity of infection (MOI) of 10 and incubated at 37°C at 5% CO2 for 2 h. Adherent bacteria were enumerated by plating on LB agar. Empty vector (pBCsk+) was used as a negative-control and APEC MT78 [Citation80] as a positive control for adherence to cell lines. Data are the averages of three independent experiments. Error bars represent standard errors of the means. (*p < 0.05, **p < 0.01, ***p < 0.001 vs empty vector by one-way ANOVA).
![Figure 6. TagB, TagC, and Sha SPATEs promote adherence to the human kidney (HEK-293) and bladder (5637) epithelial, and avian fibroblast (CEC-32) cell lines.Cell monolayers were infected with E. coli fim-negative ORN172 expressing SPATE proteins at a multiplicity of infection (MOI) of 10 and incubated at 37°C at 5% CO2 for 2 h. Adherent bacteria were enumerated by plating on LB agar. Empty vector (pBCsk+) was used as a negative-control and APEC MT78 [Citation80] as a positive control for adherence to cell lines. Data are the averages of three independent experiments. Error bars represent standard errors of the means. (*p < 0.05, **p < 0.01, ***p < 0.001 vs empty vector by one-way ANOVA).](/cms/asset/f6b01afa-fcac-4a16-82c6-d55a740d5979/kvir_a_1624102_f0006_oc.jpg)
Table 1. Hemagglutination activities of different SPATEs.
Table 2. Strains and plasmids used in this study.
Figure 7. TagB, TagC, and Sha are autoaggregating proteins.
a. Clones of E. coli fim-negative strain ORN172 expressing SPATE proteins were grown 18 h and adjusted to OD600 of 1.5 and left to rest at 4°C. Samples were taken at 1 cm from the top surface of the cultures after 3 h to determine the change in OD600. Assays were performed in triplicate, and the rate of autoaggregation was determined by the mean decrease in OD after 3 h. The autoaggregation phenotype was absent when plasmids expressing tagB, tagC, or sha were introduced into APEC strain QT598 (QT TagB, QT TagC, QT Sha respectively). Empty vector (pBCsk+) was used as a negative control and the AIDA-1 AT as a positive control for autoaggregation. Error bars represent standard errors of the means (* p < 0.05, **p < 0.01, ***p < 0.001 compared to empty vector using one-way ANOVA). b. Giemsa stain of the 5637 bladder cell line infected with a tagB expressing clone after 2 h demonstrates an aggregative adherence pattern to bladder cells (arrow head). A similar pattern was found for tagC and sha expressing clones (not shown here). Bar represents 50 µm.
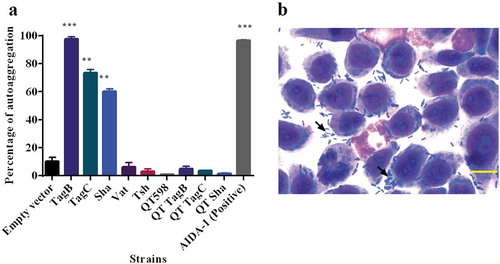
Figure 8. Sha, Vat, and Tsh promote biofilm formation.
Clones of E. coli fim-negative strain ORN172 expressing SPATE proteins were grown at different temperatures (25°C, 30°C, 37°C, and 42°C) in polystyrene plate wells for 48 h and then stained with crystal violet. Remaining crystal violet after washing with acetone was measured as absorbance at 595 nm. Data are the means of three independent experiments, and error bars represent standard errors of the means. Empty vector (pBCsk+) was used as a negative control, and a string biofilm producing Serratia strain [Citation100] served as a positive control for biofilm formation (* p < 0.05, **p < 0.01, ***p < 0.001 compared to empty vector using one-way ANOVA).
![Figure 8. Sha, Vat, and Tsh promote biofilm formation.Clones of E. coli fim-negative strain ORN172 expressing SPATE proteins were grown at different temperatures (25°C, 30°C, 37°C, and 42°C) in polystyrene plate wells for 48 h and then stained with crystal violet. Remaining crystal violet after washing with acetone was measured as absorbance at 595 nm. Data are the means of three independent experiments, and error bars represent standard errors of the means. Empty vector (pBCsk+) was used as a negative control, and a string biofilm producing Serratia strain [Citation100] served as a positive control for biofilm formation (* p < 0.05, **p < 0.01, ***p < 0.001 compared to empty vector using one-way ANOVA).](/cms/asset/0f1aa0c8-7bbb-4fb0-8adb-c4f36e0262d9/kvir_a_1624102_f0008_oc.jpg)
Figure 9. All five different SPATEs from strain QT598 induce cytopathic effects.
a. Concentrated supernatants (30 μg of protein per well) from wild type QT598 as well SPATE free Δ5ATs were incubated with human bladder cell line 5637 for 5 h and 12 h. Cytopathic cells (arrowheads) were found in the cells treated with QT598 supernatant while there were no morphological changes in the cells treated with supernatant of Δ5ATs. b. Concentrated supernatants of E. coli BL21 pBCsk+ (30 μg of protein per well) clones overexpressing different SPATEs were incubated with monolayers of 5637 bladder cell lines for 12 h at 37°C. TagB, TagC, Sha, and Vat showed more cytopathic effect (arrowheads) compared to Tsh and empty vector. c. LDH release by 5637 cells after incubation with culture filtrates of different clones (30 μg of protein per well) expressing SPATEs or from supernatants from wild-type E. coli strain QT598 and Δ5ATs mutant derivatives with 5637 human bladder cells at 37°C for 5 h and 12 h. Empty vector (pBCsk+) was used as a negative control. Lysis solution was added as a positive control for maximum LDH release. Data are the means of three independent experiments, and error bars represent the standard errors of the means (* p < 0.05, **p < 0.01, ***p < 0.001 vs empty vector using one-way ANOVA). Bar represents 50 µm.
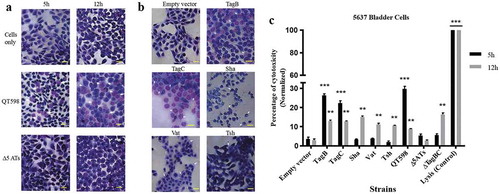
Figure 10. Role of SPATEs for E. coli QT598 in the murine model of ascending UTI.
CBA/J mice were challenged transurethrally with QT598 and isogenic strains ΔtagBC, Δsha, or Δ5ATs (wherein all 5 SPATE genes are inactivated). Mice were euthanized after 48 h, and bladder and kidneys were harvested for colony counts. a. Single-strain infections to compare wild-type strain QT598 to ΔtagBC, Δsha mutants. There were no significant differences in bacterial numbers in either the bladders or kidneys. b. Single-strain infections to compare wild-type strain QT598 to the Δ5ATs mutant. Similarly, there were no significant differences in colonization observed. c. Co-infection experiments between the QT598Δlac and the Δ5ATs mutant. The Δ5ATs mutant colonized the bladder at similar levels to the wild-type (Δlac) strain; however, the Δ5ATs strain was outcompeted in the kidneys by over 10-fold (Data are means ± standard errors of the means of 10 mice (* p < 0.05, ** p < 0.01, Mann–Whitney Test).
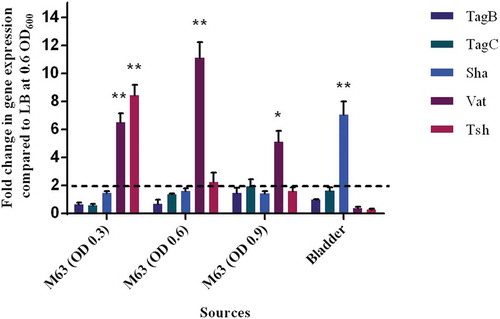
Figure 11. Differential expression of some SPATE genes occurs in vitro and in mouse bladder.
qRT-PCR analysis of SPATE gene transcription from QT598 strain grown in different conditions. Growth in rich medium (LB) to OD600 of 0.6 was used as a standard and compared to growth in M63 minimal medium (with glycerol as carbon) at different growth phases (OD600 of 0.3, 0.6. and 0.9). RNAs were also extracted from infected mouse bladder. Transcription of tsh and vat genes were significantly increased in minimal medium. Further, the sha gene was shown to be significantly upregulated in the mouse bladder. (* p < 0.05, ** p < 0.01, error bars indicate standard deviations, Student t-test). Expression of other SPATE genes was tested under similar conditions. See methods section for details concerning the calculation of gene expression levels. Expressions of other SPATE genes were similar under all conditions tested. The dashed line corresponds to the cutoff for a significant difference in expression.