Figures & data
Figure 1. Virulence and replication of group B Streptococcus (GBS) in the Galleria mellonella larvae model. Kaplan–Meier survival curves of larvae challenged with serial dilutions of ST17 bovine isolate MRI Z1-363 (A), ST17 human isolate MRI Z2-093 (B), ST283 fish isolate STIR-CD-25 (C). All survival curves show one representative experiment, with use of 10 larvae/group. PBS-injected larvae were used as a negative control, and all survived until the endpoint of the experiment. (D) Immunohistochemical analysis shows extensive GBS replication in G. melonella. Larvae were inoculated with 106 CFU of MRI Z2-366 (ST283) and collected immediately after inoculation and 6 h and 12 h postchallenge. GBS was detected through immunohistochemical staining of sections. For histological examination, sections were stained with hematoxylin and eosin. Scale bar 500 µM. Abbreviations: DT, digestive tract; FB, fat body; T, trachea. Red arrows indicate the presence of GBS, visible based on brown staining, and blue arrows indicate phagocytic cells. (E) Bacterial counts of homogenized larvae, from two distinct experiments using 3 larvae per time point, showing in vivo growth of GBS ST283 isolate STIR-CD-25 in G. mellonella larvae following infection with 106 CFUs. Errors bars represent the standard deviation (SD).
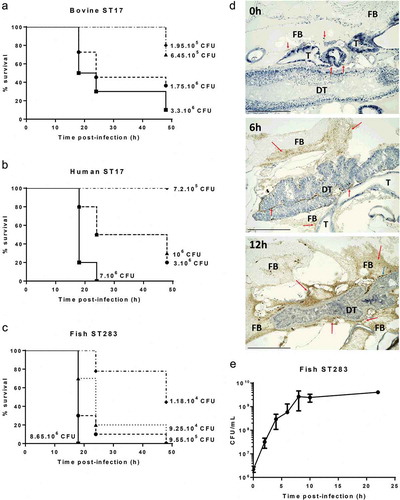
Figure 2. Virulence of group B Streptococcus (GBS) in the Galleria mellonella infection model is largely temperature independent. (A) Kaplan–Meier survival curves of larvae challenged with serial dilutions of ST-260 fish isolate STIR-CD-10 demonstrating dose-dependent survival at 28°C. Survival curves show one representative experiment, with use of 10 larvae per group. PBS-injected larvae were used as a negative control, and all survived until the endpoint of the experiment. (B) Survival of larvae at 24 h and 48 h postinfection by ST283 fish isolate (MRI Z2-366, 9.105 CFU/mL) with incubation at 37°C or 28°C. Data were collected from two distinct experiments with 10 larvae per group for each experiment, errors bars represent the SD (ns: not significant; unpaired t-test).
Figure 3. Group B Streptococcus (GBS) strains associated with hypervirulence in humans show increased virulence in Galleria mellonella. LD50 values determined by Probit analysis following infection of larvae by (A) Streptococcus agalactiae human (red), fish (blue) and bovine (green) isolates at 28°C (ST260 fish isolates, square symbols) or 37°C (non-ST260 isolates, round symbols), by (B) fish ST283 and non-ST283 isolates and by (C) human (red) and bovine (green) ST17 and non-ST17 isolates. Each datapoint represents the mean LD50 of at least two experiments in which groups of 10 larvae were infected with 4 different inoculums, errors bars represent the SD (**: p < 0.01; ***: p < 0.001; Mann–Whitney test).
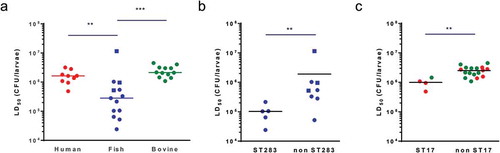
Figure 4. Antibiotic treatment affords survival of Galleria mellonella larvae against a lethal dose of group B Streptococcus (GBS). (A-C) Survival of treated (injection of 10 µL of 2 mg/mL erythromycin, ampicillin or tetracycline 2 hours post-infection) and untreated (10 µL of sterile PBS) larvae 48 hours post infection with GBS fish (A), human (B) or bovine (C) isolates. R indicates that the isolate is resistant to the corresponding antibiotic. Data was collected from at least 2 distinct experiments with 10 larvae per group for each experiment and error bars represent the SD (ns: non significant, *: p < 0.05, **: p < 0.01; ***: p < 0.001; one-way ANOVA). (D) Kaplan-Meier survival curves of larvae challenged with 9.106 CFUs of ST-283 fish isolate STIR-CD-25 demonstrating dose-dependent efficacy of ampicillin treatment. Survival curves show one representative experiment, with 5 larvae per group. Groups of non-infected larvae received injections of PBS or ampicillin (2mg/mL, 1mg/mL, 0.1mg/mL or 0.01mg/mL) were used as a negative control, and all survived until the endpoint of the experiment. Only the control group injected with 2mg/mL ampicillin is shown on the graph.