2,553
Views
18
CrossRef citations to date
0
Altmetric
Research Paper

pdh modulate virulence through reducing stress tolerance and biofilm formation of Streptococcus suis serotype 2

, , , , , , & show all
Pages 588-599 | Received 21 Mar 2019, Accepted 09 Jun 2019, Published online: 24 Jun 2019

Figures & data

Figure 1. Growth of the WT, Δpdh and CΔpdh S. suis strains in THB medium. (a) Growth was assessed by determination of OD600nm values at the time points indicated. (b) Growth was assessed by determination of viable counts at the time points indicated. Each time point represents three independent tests.
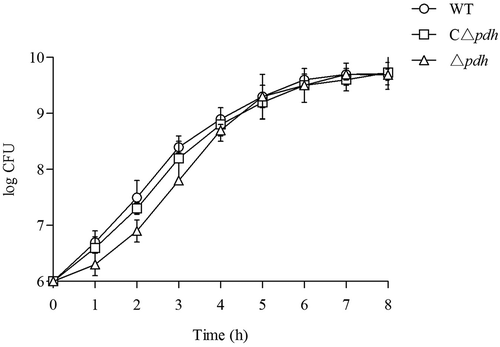
Figure 1. Growth of the WT, Δpdh and CΔpdh S. suis strains in THB medium. (a) Growth was assessed by determination of OD600nm values at the time points indicated. (b) Growth was assessed by determination of viable counts at the time points indicated. Each time point represents three independent tests.

Table 1. Calculations of LD50 on S. suis and its derivatives for mice.

Figure 2. Bacterial counts in different organs at different post infection time. (a) blood; (b) brain; (c) spleen; (d) liver; (e)kidney; (f) lung.
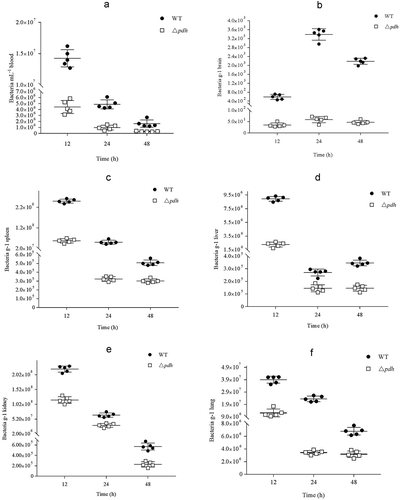
Figure 2. Bacterial counts in different organs at different post infection time. (a) blood; (b) brain; (c) spleen; (d) liver; (e)kidney; (f) lung.

Figure 3. In vitro stress assays of WT, Δpdh and CΔpdh strains.(a) heat stress assay; (b) osmotic stress assay; (c) oxidative stress assay; (d) acid stress assay. The assays were performed in duplicate and repeated three times. Significant differences are indicated.
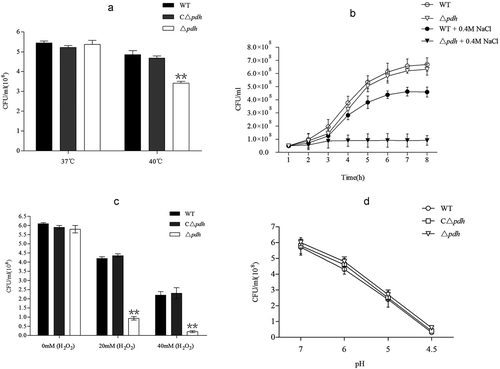
Figure 3. In vitro stress assays of WT, Δpdh and CΔpdh strains.(a) heat stress assay; (b) osmotic stress assay; (c) oxidative stress assay; (d) acid stress assay. The assays were performed in duplicate and repeated three times. Significant differences are indicated.

Figure 4. Quantitative microtiter plate assay for biofilm production of WT, Δpdh and CΔpdh strains.

The assay was performed in duplicate and repeated three times. Significant differences are indicated.
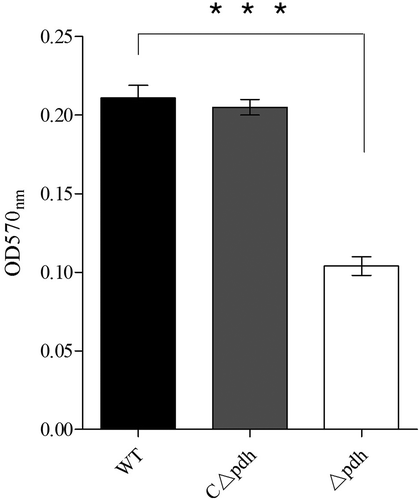
Figure 4. Quantitative microtiter plate assay for biofilm production of WT, Δpdh and CΔpdh strains.The assay was performed in duplicate and repeated three times. Significant differences are indicated.

Figure 5. Adhesion and invasive ability of WT, Δpdh and CΔpdh strains.

The adhesion and invasive ability of WT was used as a reference to determine the changes in adhesion and invasive ability of Δpdh and CΔpdh. The columns represent the means and standard deviations of three or more experiments.
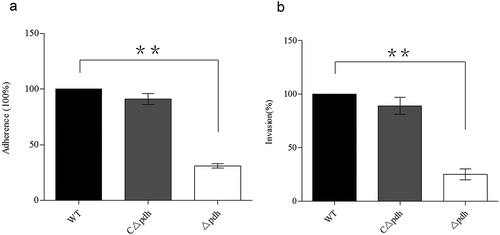
Figure 5. Adhesion and invasive ability of WT, Δpdh and CΔpdh strains.The adhesion and invasive ability of WT was used as a reference to determine the changes in adhesion and invasive ability of Δpdh and CΔpdh. The columns represent the means and standard deviations of three or more experiments.

Figure 6. Expression of S. suis adhesion genes.

Total RNA of WT, Δpdh and CΔpdh strains was extracted for qPCR. The 16S RNA gene was used as a reference. The figure shows that the gene expression level in the WT strain is 100%, and the gene expression in the Δpdh and CΔpdh strains were the relative to expression in the WT strain genes. Data from three independent assays are expressed as mean ± SD.
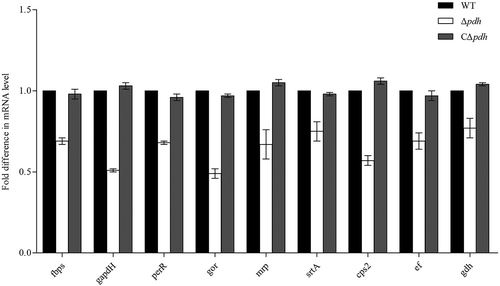
Figure 6. Expression of S. suis adhesion genes.Total RNA of WT, Δpdh and CΔpdh strains was extracted for qPCR. The 16S RNA gene was used as a reference. The figure shows that the gene expression level in the WT strain is 100%, and the gene expression in the Δpdh and CΔpdh strains were the relative to expression in the WT strain genes. Data from three independent assays are expressed as mean ± SD.

Figure 7. Intracellular growth of the S. suis 2 WT, Δpdh and CΔpdh strains in RAW264.7 macrophages.

The assay was performed in duplicate and repeated three times. Significant differences are indicated.
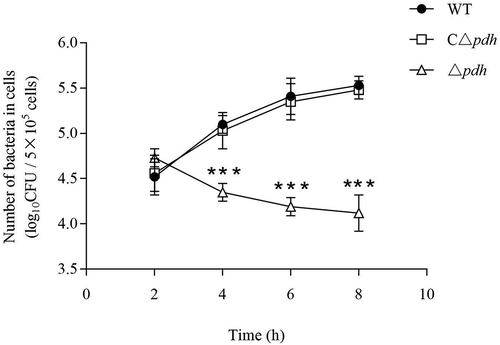
Figure 7. Intracellular growth of the S. suis 2 WT, Δpdh and CΔpdh strains in RAW264.7 macrophages.The assay was performed in duplicate and repeated three times. Significant differences are indicated.

Table 2. Bacterial strains and plasmids used in this study.

Table 3. Primers used in this study.

Table 4. Primers for qPCR used in this study.