Figures & data
Figure 1. (a) Dose-dependent depigmentation of S. aureus. S. aureus cells grown in the presence of different concentrations of farnesol showed dose-dependent loss of pigmentation. (b) Farnesol sensitization and desensitization of S. aureus modulate cell pigmentation. Sensitization of S. aureus cells through daily passaging (P) in media supplemented with 50 µM of farnesol resulted in progressive loss of pigment with full depigmentation occurring at the third passage (FP3). However, desensitization of cells through passaging in farnesol-free media restored pigmentation (P5). The farnesol-induced depigmentation in the farnesol-sensitized S. aureus cells (FP3) is comparable to that in the S. aureus mutant strain (∆crtM) lacking staphyloxanthin. 0F are control cells not exposed to farnesol.
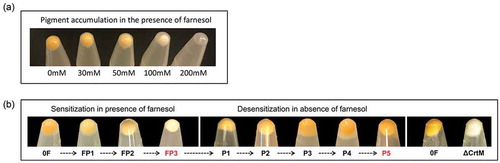
Figure 2. HPLC analysis of cell extracts from sensitized and desensitized cells identifies the pigment as staphyloxanthin (STXN). Ethanol extracts from control, farnesol-sensitized, and desensitized cells were monitored at 450 nm. Based on the resultant chromatograms, a peak with an average retention time of 15.033 min, consistent with that reported for STXN, was detected in extracts from control cells but not from farnesol-sensitized cells. In contrast, STXN peaks similar to those in control cells were detected in the farnesol-desensitized cells, indicating restoration of the pigment upon removal of farnesol supplementation from the media. HPLC analyses were obtained from three independent, biological replicates; representative chromatograms and images of extracts are shown.
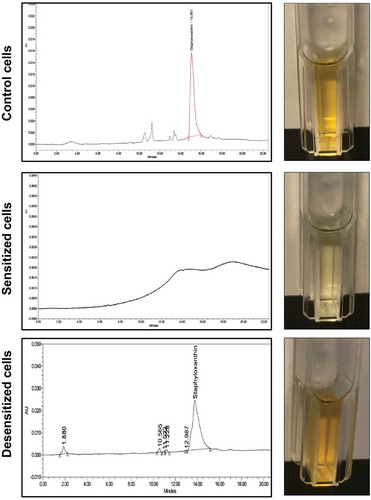
Figure 3. Intracellular ROS accumulation and depigmentation of S. aureus cells grown under various conditions. (a) ROS accumulation was quantitatively assessed based on measurement of the intensity of fluorescence following staining with CellROXTM green, which becomes fluorescent after selective reduction by intracellular ROS. Cells were grown for 18 hrs in the absence (P1) or presence of farnesol (FP1) or H2O2; similarly, ROS was comparatively assessed in the sensitized cells (FP3) and their control cells (P3); to assess the rapid response of cells to farnesol exposure, cells were also grown with farnesol for 3 hr and ROS accumulation was measured. The ∆crtM mutant was also serially exposed to farnesol and ROS accumulation was evaluated following first (∆crtM FP1) and third passage (∆crtM FP3) with ∆crtM P1 and ∆crtM P3 serving as respective controls. Results demonstrated rapid induction of ROS within 3 hr of exposure to farnesol, which although remained significantly higher than in control cells, was lower in the cells exposed to farnesol overtime (FP1 and FP3) compared to their respective controls (P1 and P3). Similarly, farnesol also induced ROS production in the ∆crtM mutant. ROS level in the H2O2 exposed cells was comparable to that induced by farnesol. (b) Simultaneous measurement of pigment from extracts of cells demonstrated a significant decrease in pigment production in the farnesol-exposed cells (FP1, FP3). Growth with H2O2 for 18 hrs had no effect on pigment production compared to controls (P1 and P3) while, as expected, the ∆crtM mutant showed no pigmentation. * p < 0.05; ** p < 0.01; *** p < 0.001; **** p < 0.0001; (ns): not significant.
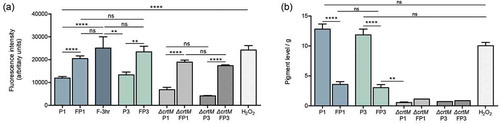
Figure 4. Farnesol-sensitized cells (FP3) do not exhibit defects in growth rate, adhesion or biofilm formation compared to their control cells (P3). (a) In order to determine if farnesol sensitization exerts an adverse effect on the cells, the growth rate was evaluated during the sensitization of cells. Based on optical density measurements, the farnesol-sensitized cells (FP1, FP2, and FP3) displayed similar logarithmic growth curves with a modest lag in growth observed within the first 8 hrs which subsequently, was comparable to that of respective control cells (P1, P2, and P3) indicating no apparent growth defects. The MTS metabolic assay was used to comparatively assess adherence and biofilm formation capabilities following a 90-min adhesion period and 24 hr biofilm growth. Results indicated no apparent defects in the sensitized cells (FP3) in (b) adhesion or (c) biofilm formation compared to control cells (P3). (ns): not significant. (d) Leakage assay indicates no disruption in cell membrane integrity in the farnesol-sensitized cells. Quantitative fluorimetric assay showed no significant differences between the farnesol treated (FP1, FP3) and control (P1, P3) cells in the level of internalized propidium iodide indicating no damage to the cell membrane. Cells exposed to 70% ethanol were used as positive controls.
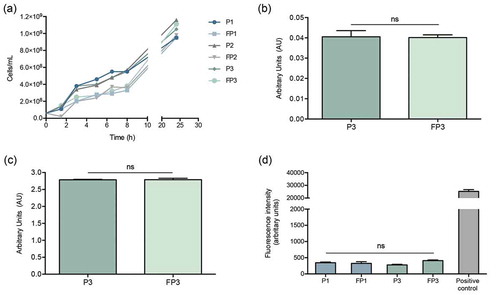
Figure 5. Transmission electron micrographs of farnesol-sensitized cells demonstrating no adverse effects on cell morphology. Farnesol-sensitized cells (FP3) were processed for TEM analysis in order to determine if farnesol-sensitization compromises cell integrity. Images revealed no noticeable abnormalities in the cell wall structure and overall cell morphology in sensitized cells (FP3) when compared to their passaged control cells (P3) and cells from 18-hr culture (control).
Table 1. Functional classification of S. aureus genes differentially regulated in farnesol-sensitized cells compared to control cells. RNA-sequencing was used to assess gene expression in the sensitized cells.
Figure 6. (a) Farnesol-sensitized cells exhibit decreased susceptibility to killing by H2O2. Killing assays demonstrated decreased susceptibility of the sensitized cells (FP3) to H2O2 compared to their control cells (P3). (b) Farnesol-sensitized cells show reduced susceptibility to phagocytic killing. In vitro macrophage phagocytosis assays demonstrated an increase in survival of sensitized cells (FP3) within phagocytic cells compared to control cells (P3). FP3 also showed reduced susceptibility to macrophage killing at 3 hrs post-phagocytosis compared to the total ingested cells (0 h). * p < 0.05; ** p < 0.01; *** p < 0.001; (ns): not significant.
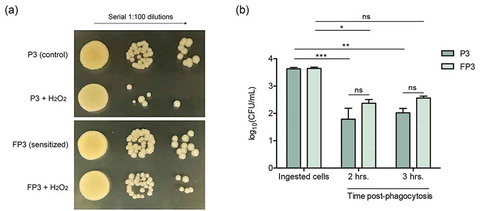
Figure 7. Theoretical model of farnesol binding to the CrtM enzyme responsible for staphyloxanthin synthesis. The high-resolution crystal structure of CrtM bound to its substrate farnesyl diphosphate was utilized to model how farnesol may interact with CrtM. (a) CrtM (green) bound to farnesyl thiopyrophosphate (from PDB ID: 3W7F); magnesium counter-ions are depicted as green spheres; the modeled solvation sphere is shown as semitransparent red spheres. (b) Model of CrtM bound to farnesol. The terminal sulfur-diphosphate of the farnesol backbone was replaced with a hydroxyl and the interface was resolved. (c) Hydrophobicity plot of the CtrM-farnesol model. The surface of CtrM surface is depicted in a hydrophobicity scale ranging from true red (most hydrophobic) to white (most hydrophilic). Unlike the altered electrostatics shown in panels A and B, the farnesol backbone is predicted to interact identically with the large hydrophobic (red) patches of CrtM in the interior of the pseudo-dimeric interface.
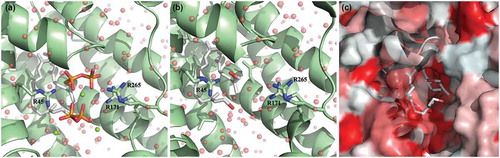
Figure 8. Impact of co-growth with C. albicans on S. aureus cell pigmentation. (a) HPLC measurement of farnesol secreted by C. albicans in biofilm spent culture media demonstrated ~75% reduction in farnesol in media from the deficient strain compared to farnesol-producing strain. (b) Pigment measurement from extracts of S. aureus cells grown planktonically with C. albicans demonstrated significant loss in pigment production during growth with C. albicans (Sa+Ca). In contrast, no significant changes in pigmentation in the S. aureus cells grown with the C. albicans farnesol-deficient strain (Sa+Ca-f). (c) Pigment measurement in extracts from S. aureus cells recovered from mixed biofilms with C. albicans similarly demonstrated significant loss in pigment production during growth with C. albicans (Sa+Ca) but not with the farnesol-deficient C. albicans strain (Sa+Ca-f). * p < 0.05; ** p < 0.01; (ns): not significant.
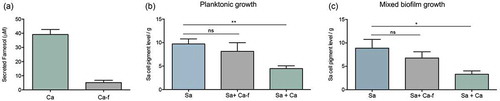
Table 2. Redox regulators in S. aureus and their regulon genes and functions.
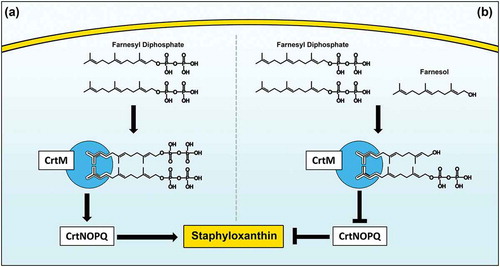
Figure 9. Proposed model for the inhibition of staphyloxanthin production in S. aureus by farnesol. (a) Staphyloxanthin biosynthesis begins with the CrtM enzyme binding to its substrate farnesyl diphosphate (FPP), which involves the head-to-head condensation of two molecules of FPP to form dehydrosqualene, eventually yielding staphyloxanthin. (b) However, due to close structural homology to FPP, farnesol competes with FPP for CrtM binding by occupying the catalytic site on the enzyme. Since farnesol lacks the required diphosphate groups, the CrtM enzyme is unable to complete the condensation reaction to synthesize dehydrosqualene, thus halting staphyloxanthin synthesis.