Figures & data
Figure 1. Impact of complement and ATRs on asymptomatic nasal colonization following i.n. infection versus invasive disease following i.p. injection of Nme in mice. Nasal colonization (a,b): Interbreeds of mice expressing human CEACAM1 with mice lacking C3 (C3−/-), C5 (Hc°/0), C3aR (C3ar1−/-), C5aR1 (C5ar1−/-) or C5aR2 (C5ar2−/-) were intranasally infected with 105 CFU of Nme and sacrificed at indicated time points (day 1, 3, 14) to sample nasal tissues for viable Nme (n = 11 animals per cohort). (a) Recovered Nme expressed as CFU per individual animal at indicated time points after infection. (b) Percentage of mice colonized at each time point. Invasive disease (c-h): (c,e) 11 to 15 mice of each genotype were i.p. infected with a total dose of 105 CFU of serogroup B Nme strain MC58 per mouse and followed for 48 h before cessation of the experiment. (f-h) Seven WT and 5 C3ar1−/- mice were subjected to a sub-lethal dose of 5 × 10⁴ CFU per animal. (c,f): Survival rates after infection. (d,g) Clinical scoring over time. Note that only the first 24 h is included in the analysis, since only a single animal in the WT and C3ar1−/- cohort survived past this time point. (e,h) Bacteremia in tail vein blood samples during the course of infection as indicated by the time points below the x-axis. Bacteremia plotted at ’18–27 h’ includes values at 24 h of all mice surviving longer than 27 h and the values of the non-survivors at their time of death (by sacrificing at the “humane endpoint”) within this time window. Closed circles indicate surviving animals, open circles indicate non-survivors. Limit of detection was 500 CFU/ml.
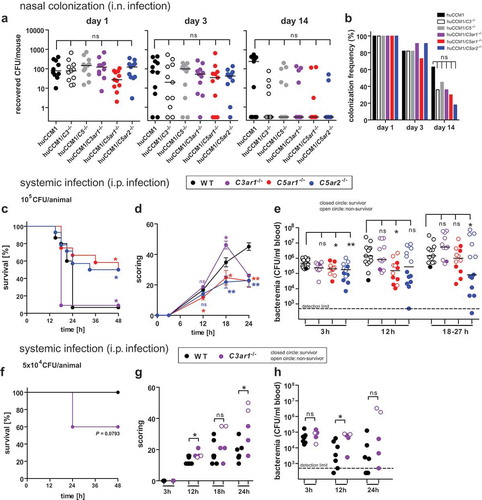
Figure 2. Cytokine and chemokine response of C3ar1−/-, C5ar1−/- and C5ar2−/- mice 12 h after intraperitoneal infection with N. meningitidis. Tail vein blood samples from the same mouse cohorts as in were analyzed for inflammatory cytokines and chemokines at 12 h after infection. Controls were samples from the same mice one week prior to the experiment. Plotted are means ± standard deviation.
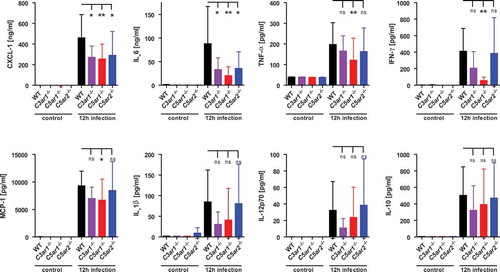
Figure 3. Neutrophil responses of C3ar1−/-, C5ar1−/- and C5ar2−/- mice in ex vivo whole blood infection. Hirudin-anticoagulated whole blood was infected either with Nme or stimulated with PMA versus PBS as a negative control. Samples were incubated at 37°C rotating over top. (a) The oxidative burst response of mouse neutrophils as assessed by the DHR123-assay. Blood samples were treated for 1 h either with PBS, 107 CFU/ml of Nme or with 100 nM PMA as a positive control. Values of the PBS-condition for each individual mouse sample were subtracted from the others in order to correct for the intrinsic GFP-signal of cells from C5ar2−/- mice. Thus, the y-axis plots ΔMFI values. (b) Neutrophil degranulation as measured by an increase of CD11b on the cell surface. Blood samples were treated for 1 h with PBS (negative control), 107 CFU/ml Nme or with 100 mM PMA (positive control). Values obtained with the isotype-control for the anti-CD11b antibody were subtracted in order to correct for the intrinsic GFP-signal of cells from C5ar2−/- mice. (c) Phagocytosis of GFP-expressing Nme by neutrophils in mouse whole blood. Blood samples were infected with 108 CFU/ml Nme and incubated for 1 h and GFP-signal of the cells measured by flow cytometry. In order to correct for the intrinsic GFP-signal of C5ar2−/- neutrophils, the mean MFI difference between WT and C5ar2−/- was subtracted from all C5ar2−/- neutrophils. (d) Survival of Nme in mouse blood. Whole blood samples were infected with 105 to 106 Nme and samples were taken immediately (0 h) or after 4 h of incubation rotating at 37°C (4 h) and serial dilutions plated on blood agar plates for CFU enumeration. (e) IL-6 plasma levels at 4 h after infection of mouse whole blood with 106 CFU/ml of Nme strain MC58.
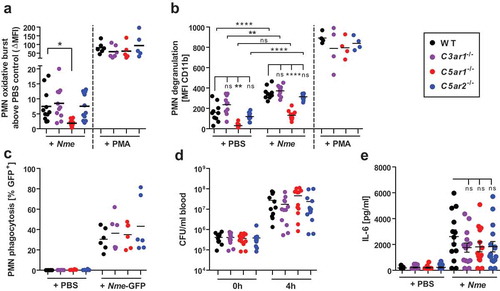
Figure 4. ERK1/2 phosphorylation in bone marrow-derived murine macrophages in response to C5a and/or Nme. Macrophages were derived from WT, C5ar1−/- or C5ar2−/- mice and differentiated for 8 days in L929-conditioned medium and their phenotype (CD68+CD11b+F4/80+) verified by flow cytometry. Cells were stimulated with murine C5a (10 nM final concentration), Nme (heat-inactivated; corresponding to 108/ml), or both, for the indicated duration (5 min, 15 min, 30 min) before harvesting samples. (a) Western blots probed with anti-phospho-ERK1/2 (left panels) or with anti-ERK1/2 (right panels) as a loading control. (b) Densitometric analysis of the Western blot bands from four independent experiments.
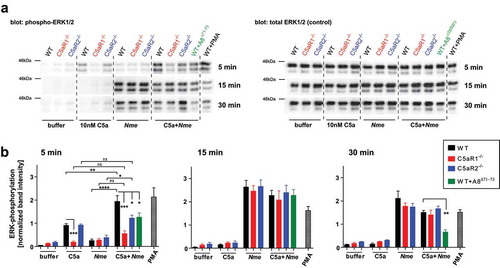
Figure 5. Experimental Nme sepsis in WT mice treated with agonists or antagonists of the anaphylatoxin receptors. Mice were subjected to intraperitoneal treatment with antagonists to C5aR1 (PMX205), C5aR1 plus C5aR2 (A8Δ71−73), C3aR (SB290157), or with a super-agonist (WWGKKYRASKLGLAR) of C3aR, or with vehicle alone (sterile 5% glucose solution) starting prior to infection and continued throughout the experiment (see Methods). Each mouse was intraperitoneally infected with a total of 105 CFU of Nme. Mice were monitored for 48 h before the experiment cessation. (a) Survival curves of mice. (b) Bacteremia at indicated time points of the mice. Bacteremia plotted at ’18–27 h’ includes values at 24 h of all mice surviving longer than 27 h and the values of the non-survivors at their time of death (by sacrificing at the “humane endpoint”) within this time window. Closed circles indicate surviving animals, open circles indicate non-survivors. Limit of detection was 500 CFU/ml. (c) Inflammatory mediators IL-6 and CXCL-1 as measured by ELISA in tail vein blood samples obtained from the same mice as in A at 12 h after infection. Plotted are means ± SEM.
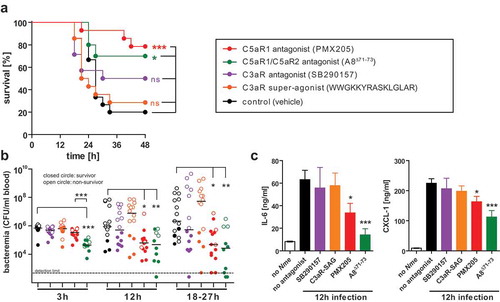
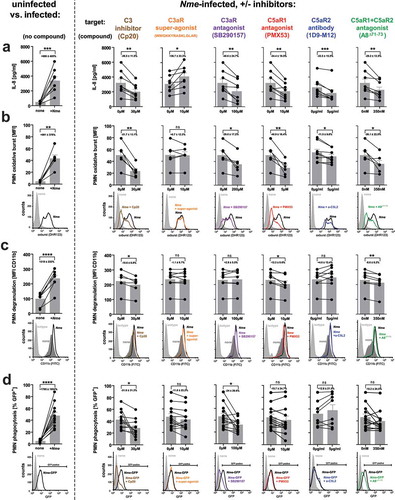
Figure 6. Innate immune responses in human whole blood during infection with Nme in presence of specific C3 or ATR antagonists. Hirudin-anticoagulated human blood samples (n = 6 donors) were incubated for 10 min with the indicated antagonists before the addition of Nme. The target structures are indicated above the graphs, with the agent indicated in brackets. In the graphs, values obtained from the same individual are represented as dots connected with lines; the bar graphs plot mean ± SEM of the same data. The average reduction of the analyzed response relative to no antagonist addition is given as percentage ± SD in each graph. (a) IL-8 response at 90 min of infection with 106 CFU/ml Nme at 37°C rotating over top. (b) Neutrophil oxidative burst as measured by DHR123 assay in human whole blood after infection with 107 CFU/ml Nme at 1 h of incubation at 37°C rotating over top. Values are expressed as mean fluorescence intensity (MFI). Representative histograms from the flow cytometric analysis are shown directly below the graphs. (c) Neutrophil degranulation assessed as surface CD11b by flow cytometry. Data are plotted as MFI, representative histograms are shown directly below the graphs. (d) Neutrophil phagocytosis of GFP-expressing Nme (108 CFU/ml) as assessed by flow cytometry after incubation in whole blood for 1 h. Date are plotted as % of GFP-positive neutrophils; representative histograms and gating are shown directly below the graphs.