Figures & data
Figure 1. Phenotypic and genotypic changes observed between UT127 and UT205 in axenic cultures. (a). Growth curves of UT127 and UT205 in Sauton’s and Middlebrook 7H9 broth media over 10 days, measured at an optical density (OD) of 600nm. (b). Membrane vesicle (MVs) secretion for UT205 and UT127 measured as a correlation to the total protein content. Both graphs are representative experiments of a series of three independent experiments performed. Each data point represents the average of three measurements. Standard deviation bars are showed for each graph. (c). Graphical representation of the H37Rv chromosome with variations observed in each of the Colombian studied strains, UT205, and UT127, was performed with CIRCOS package [Citation87]. From outside to inside, LSPs UT205, LSPs UT127, SNPs and short variants UT205 and SNPs and short variants UT127.
![Figure 1. Phenotypic and genotypic changes observed between UT127 and UT205 in axenic cultures. (a). Growth curves of UT127 and UT205 in Sauton’s and Middlebrook 7H9 broth media over 10 days, measured at an optical density (OD) of 600nm. (b). Membrane vesicle (MVs) secretion for UT205 and UT127 measured as a correlation to the total protein content. Both graphs are representative experiments of a series of three independent experiments performed. Each data point represents the average of three measurements. Standard deviation bars are showed for each graph. (c). Graphical representation of the H37Rv chromosome with variations observed in each of the Colombian studied strains, UT205, and UT127, was performed with CIRCOS package [Citation87]. From outside to inside, LSPs UT205, LSPs UT127, SNPs and short variants UT205 and SNPs and short variants UT127.](/cms/asset/d5c1df65-8d24-4b16-82fd-d17dbbf25650/kvir_a_1642045_f0001_oc.jpg)
Figure 2. Venn diagram representation of the up-regulated genes among UT127 and UT205. (a). Shows the number and percentage of DE genes for UT127 and UT205 in Middlebrook 7H9 medium and (b). Shows the number and percentage of DE genes for UT127 and UT205 in Sauton’s medium. The UT127 condition appears in blue and UT205 in green. The graphs were obtained using Venny 2.1 software.
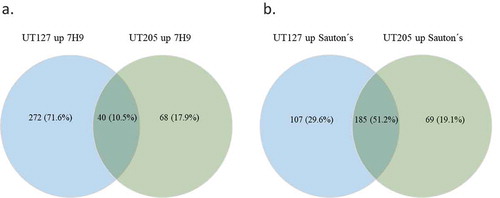
Table 1. Main Gene Ontology (GO) functional categories for UT205 and UT127.
Figure 3. Analysis of differentially expressed genes in Sauton’s medium for UT205 and UT127. (a). STRING analysis of the up-regulated genes for UT205 in Sauton’s medium. (b). STRING analysis of up-regulated genes for UT127 in Sauton’s medium. (c). Volcano plot analysis showing the differentially expressed (DE) genes for UT205 in Sauton’s medium and in (d). showing the DE genes for UT127 in Sauton's medium as well. Logarithm base 2 of the fold change (log2FC). Graphs were obtained using the STRING protein-protein interactions networks software version 11.0. The red color (right) is for up-regulated and green (left) for down-regulated genes in Sauton’s medium.
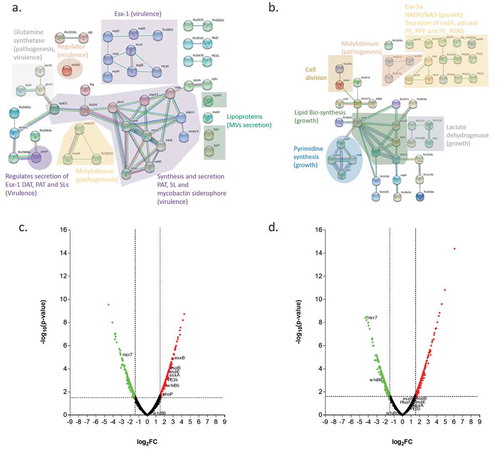
Table 2. Differentially expressed sRNAs for UT127 and UT205.
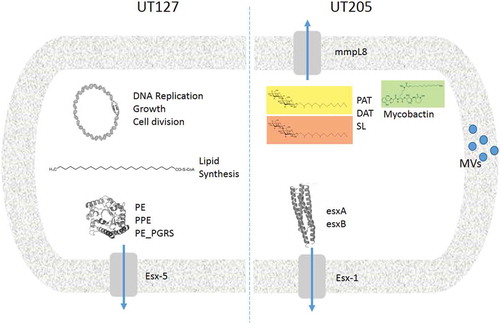
Figure 4. Comparative model of the main virulence factors associated with UT127 and UT205 in Sauton’s medium. Representative diagram to show the differences between UT127 and UT205. The main pathways that are activated by UT127 are more related to survival while for UT205 are more related to virulence.