Figures & data
Figure 1. Construction process of the recombinant pPG-Δ-E-α-β2-ε-β1 plasmid. The constitutive expression plasmid pPG-T7g10-PPT contains a HCE strong constitutive promoter, a T7g10 transcriptional enhancer, a PgsA anchor from Bacillus subtilis, and an rrnBT1T2 terminator.
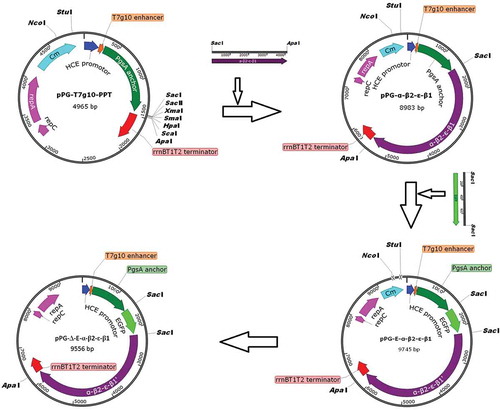
Figure 2. Constitutive expression of proteins. (a) The pPG-Δ-E-α-β2-ε-β1/L. casei 393 cultured in normal MRS broth was analyzed by ultra-high-resolution microscopy, and results showed that significant green fluorescence was observed (Figure 2(a): A), but not in the pPG-T7g10-PPT/L. casei 393 strain (Figure 2(a): B). (b) Flow cytometry results showed that EGFP was effectively expressed by pPG-Δ-E-α-β2-ε-β1/L. casei 393 (Figure 2(b): A). (c) Western blot results showed that the α-β2-ε-β1 fusion protein can be constitutively expressed by the pPG-Δ-E-α-β2-ε-β1/L. casei 393 strain using raffinose (R), sucrose (S), lactose (L), trehalose (T), glucose (Glu), and fructose (F) as carbon sources, respectively.
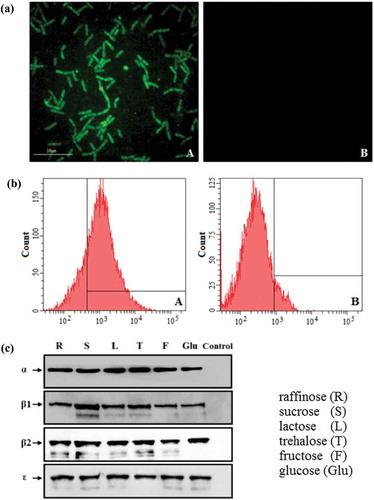
Table 1. The percentage of CFDA-SE-labeled recombinant lactobacilli in the different intestinal sections of mice after orogastric intubation.
Figure 3. Antigen-specific IgG antibodies in sera. Sera samples collected from mice orally immunized with pPG-Δ-E-α-β2-ε-β1/L. casei 393, pPG-2-α-β2-ε-β1/L. casei 393, pPG-T7g10-PPT/L. casei 393, and PBS were determined for levels of anti-α specific IgG (a), anti-β2 specific IgG (b), anti-ε specific IgG (c), and anti-β1 specific IgG (d) by ELISA (*p < 0.05, **p < 0.01). The results are presented as mean ± SD in each group.
Figure 4. Antigen-specific IgA antibodies in feces. Fecal samples were collected from each group on days 0, 7, 14, 21, 28, 35, and 42 after the primary immunization, and the levels of anti-α specific IgA (a), anti-β2 specific IgA (b), anti-ε specific IgA (c), and anti-β1 specific IgA (c) were determined by ELISA (*p < 0.05, **p < 0.01). The results are presented as mean ± SD of each group.
Figure 5. Antigen-specific IgA antibodies in intestinal mucus. Intestinal mucus samples collected from each group on days 0, 7, 14, 21, 28, 35, and 42 after the primary immunization, and levels of anti-α specific IgA (a), anti-β2 specific IgA (b), anti-ε specific IgA (c), and anti-β1 specific IgA (c) were determined by ELISA (*p < 0.05, **p < 0.01). The results are presented as mean ± SD of each group.
Figure 6. The levels of cytokines IL-2, IL-4, IL-10, IL-12, IL-17, and IFN-γ in sera samples determined by ELISA. The results are presented as mean ± SD of each group.
Figure 7. The percentage of CD4+ and CD8 + T cells was determined by flow cytometry. On day 35 after the primary immunization, the spleen lymphocytes of mice in the pPG-Δ-E-α-β2-ε-β1/L. casei 393, pPG-T7g10-PPT/L. casei 393, and PBS groups were respectively isolated, and then the percentage of CD4+ and CD8+ T cells was analyzed by flow cytometry. The results are presented as mean ± SD in each group.
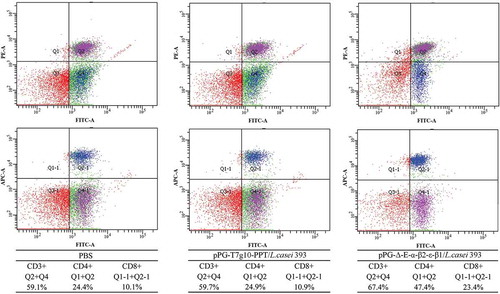
Figure 8. Lymphoproliferation. Spleen lymphocytes of mice in the pPG-T7g10-PPT/L. casei 393, pPG-Δ-E-α-β2-ε-β1/L. casei 393, and PBS groups were collected on day 42 after the primary immunization and were restimulated with the C. perfringens α-β2-ε-β1 fusion protein, and then lymphoproliferation was analyzed by the MTT assay. The results are presented as mean ± SD of each group.
Figure 9. Immune protection efficacy of recombinant lactobacillus. (a) Protection rate for immunized mice in each group against mixture of C. perfringens type A, type C, and type D crude toxins. (b) Protection rate for immunized mice in each group against mixture of C. perfringens type A, type C, and type D.
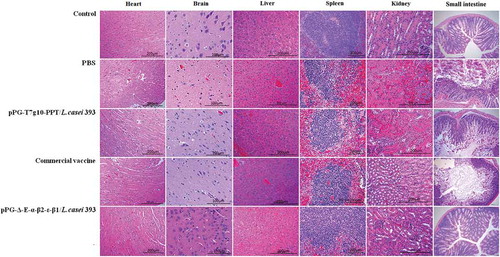
Figure 10. Histopathological changes of immunized mice post-challenge. After challenged with C. perfringens, histopathological changes were observed in the intestine, kidney, liver, spleen, heart, and brain of immunized mice with the pPG-Δ-E-α-β2-ε-β1/L. casei 393, pPG-T7g10-PPT/L. casei 393, commercially available vaccine, and PBS. Sections were stained with hematoxylin and eosin, and photographed at 40× magnification.