
Figures & data
Figure 1. Absence of CsrA sequestration by the 5ʹUTR of fim mRNA and CsrB/C allows PefA expression but only in specific culture conditions.
Western blot against PefA or Hsp60 (loading control) proteins. S. Typhimurium 14028 wild-type and ΔfimA-FΔsirA mutants were grown statically at 37°C in TSB-MES pH 5.1 (a) in 5 mL of culture medium put in a 50 mL conical tube containing a sterile 200 μL pipet tip or (b) in 20 mL of culture medium put in a 100 mL flask until stationary phase. For PefA results, the time of membrane exposure necessary to obtain the signal is mentioned.
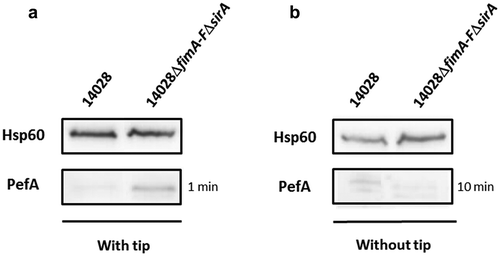
Figure 2. H-NS strongly represses pef mRNA level and PefA protein expression in standing cultures at pH 5.1.
S. Typhimurium 14028 wild-type, Δhns::kan mutants and the complemented strains were grown at 37°C in TSB-MES pH 5.1 under standing conditions. At stationary phase, cells were harvested for RT(reverse transcription)-PCR and Western blot analyses. At least three independent Δhns::kan mutants were tested and the experiment was repeated at least twice. (a) Estimation of pefB, pefA, pefC and orf5 mRNA levels by RT-PCR. PCR were performed on mRNA samples without RT (-) or with RT (+). A representative experiment is presented. (b) Western blot against PefA or Hsp60 (loading control) proteins. For the PefA results, the time of membrane exposure necessary to obtain the signal is mentioned. A typical result obtained with three different Δhns::kan mutants (1 to 3) and three different complemented mutants (a to c) is shown.
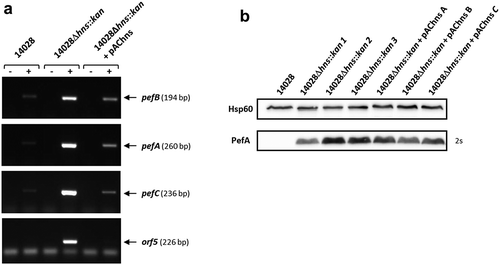
Figure 3. The promoter upstream of pefB is the main target of H-NS.
(a) Diagram representing the PpefB and PpefA promoters of the S. Typhimurium pef operon and the DNA fragments cloned upstream of the lacZ gene used as a transcriptional reporter. (b and c) β–galactosidase activities expressed by pQF-PpefA or pQF-PpefB transcriptional fusions in S. Typhimurium 14028 wild-type strain or its derivatives after growth until stationary phase at 37°C in TSB-MES pH 5.1 under standing conditions without a sterile pipette tip (b) and in presence of a sterile pipette tip (c). Aliquots were collected for measurements of the OD600nm and β–galactosidase activity. β-galactosidase activities are expressed in Miller units. Average values (± standard error of the mean) of activity units were calculated based on at least three independent assays performed in duplicates for each strain. For Δhns::kan strains, several mutants were tested in each assay and results presented are the mean of the data obtained for all these mutants. (d) Western blot against PefA or Hsp60 proteins (loading control) prepared from S. Typhimurium strains grown at 37°C until stationary phase in TSB-MES pH 5.1 under standing conditions. For the PefA results, the time of membrane exposure necessary to obtain the signal is mentioned. At least three independent Δhns::kan and Δhns::kanΔPpefB mutants were tested and a representative result is shown.
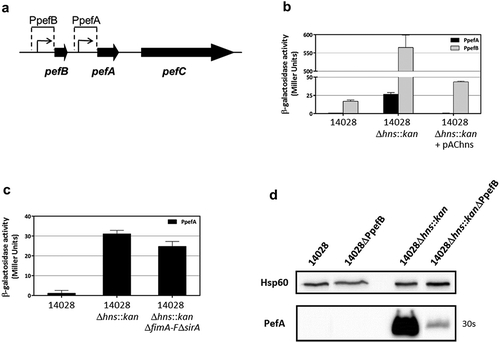
Figure 4. Hha and YdgT negatively regulate PefA expression by acting on the pefB promoter.
S. Typhimurium 14028 and its derivative strains were grown statically at 37°C in TSB-MES pH 5.1. At stationary phase, cells were harvested for Western blot analysis, RT-PCR and β-galactosidase activity measurement. At least three independent assays were performed for each experiment. (a) Western blot against PefA or Hsp60 proteins (loading control) prepared from S. Typhimurium wild-type, Δhha and ΔydgT single mutants, ΔhhaΔydgT double mutant and its complemented strain. For PefA results, the time of membrane exposure necessary to obtain the signal is mentioned. (b) Estimation of pefB, pefA, pefC and orf5 mRNA levels by RT-PCR. PCR were performed on mRNA samples without RT (-) or with RT (+). (c) β–galactosidase activities expressed by pQF-PpefA and pQF-PpefB transcriptional fusions in S. Typhimurium wild-type, ΔhhaΔydgT double mutant and its complemented strain. β-galactosidase activities are expressed in Miller units. Average values (± standard error of the mean) of activity are presented. (d) Western blot against PefA or Hsp60 proteins (loading control) prepared from S. Typhimurium wild-type, ΔPpefB, ΔhhaΔydgT double mutant and the ΔhhaΔydgTΔPpefB triple mutant. For PefA results, the time of membrane exposure necessary to obtain the signal is mentioned.
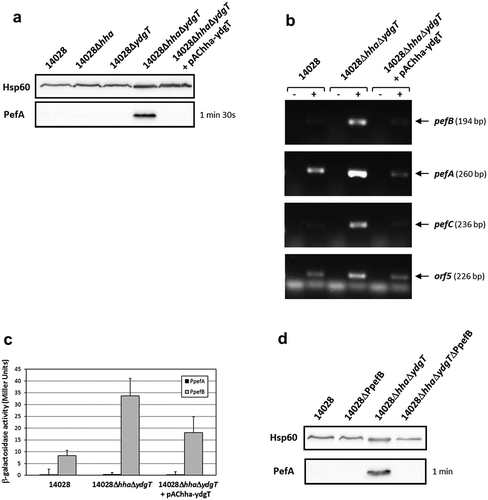
Figure 5. Higher PefA expression at pH 7.1 than pH 5.1 in Δhns, ΔhhaΔydgT or ΔfimA-FΔsirA mutants.
S. Typhimurium 14028 and isogenic mutants were grown at 37°C in TSB-MES pH 5.1 or pH 7.1 under standing or shaking conditions. At stationary phase, cells were harvested for Western blot analysis and β-galactosidase activity measurement. (a) Western blot against PefA or Hsp60 proteins (loading control) prepared from wild-type strain and several Δhns::kan mutants. A typical result is presented for each condition tested. For PefA results, the time of membrane exposure necessary to obtain the signal is mentioned. (b) β–galactosidase activities expressed by the transcriptional fusion pQF-PpefB in S. Typhimurium 14028 wild-type, Δhns::kan mutant and its complemented strain. Activities are expressed in Miller units. Average values (± standard error of the mean) of activity were calculated based on at least three independent assays. For Δhns::kan strain, several mutants were tested in each assay. (c) Western blot against PefA or Hsp60 proteins (loading control) prepared from wild-type strain and ΔhhaΔydgT double mutant. For the PefA results, the time of membrane exposure necessary to obtain the signal is mentioned. (d) β–galactosidase activity expressed by the transcriptional fusion pQF-PpefB in S. Typhimurium 14028 wild-type, ΔhhaΔydgT double mutant and its complemented strain. Activities are expressed in Miller units. Average values (± standard error of the mean) of activity were calculated based on at least three independent assays. (e) Western blot against PefA or Hsp60 proteins (loading control) prepared from wild-type strain and ΔfimA-FΔsirA double mutant. Bacteria were grown with or without a sterile pipette tip added in the culture medium to mimick the conditions used by Sterzenbach et al. who demonstrated the role of fim and sirA in the regulation of Pef expression [Citation23]. For the PefA results, the time of membrane exposure necessary to obtain the signal is mentioned.
![Figure 5. Higher PefA expression at pH 7.1 than pH 5.1 in Δhns, ΔhhaΔydgT or ΔfimA-FΔsirA mutants.S. Typhimurium 14028 and isogenic mutants were grown at 37°C in TSB-MES pH 5.1 or pH 7.1 under standing or shaking conditions. At stationary phase, cells were harvested for Western blot analysis and β-galactosidase activity measurement. (a) Western blot against PefA or Hsp60 proteins (loading control) prepared from wild-type strain and several Δhns::kan mutants. A typical result is presented for each condition tested. For PefA results, the time of membrane exposure necessary to obtain the signal is mentioned. (b) β–galactosidase activities expressed by the transcriptional fusion pQF-PpefB in S. Typhimurium 14028 wild-type, Δhns::kan mutant and its complemented strain. Activities are expressed in Miller units. Average values (± standard error of the mean) of activity were calculated based on at least three independent assays. For Δhns::kan strain, several mutants were tested in each assay. (c) Western blot against PefA or Hsp60 proteins (loading control) prepared from wild-type strain and ΔhhaΔydgT double mutant. For the PefA results, the time of membrane exposure necessary to obtain the signal is mentioned. (d) β–galactosidase activity expressed by the transcriptional fusion pQF-PpefB in S. Typhimurium 14028 wild-type, ΔhhaΔydgT double mutant and its complemented strain. Activities are expressed in Miller units. Average values (± standard error of the mean) of activity were calculated based on at least three independent assays. (e) Western blot against PefA or Hsp60 proteins (loading control) prepared from wild-type strain and ΔfimA-FΔsirA double mutant. Bacteria were grown with or without a sterile pipette tip added in the culture medium to mimick the conditions used by Sterzenbach et al. who demonstrated the role of fim and sirA in the regulation of Pef expression [Citation23]. For the PefA results, the time of membrane exposure necessary to obtain the signal is mentioned.](/cms/asset/8058c9c5-e5e8-4b81-96ce-0a87f5775275/kvir_a_1682752_f0005_b.gif)
Figure 6. Deletion of hha and ydgT in a Δhns::kan mutant has a more pronounced effect on PefA expression at pH 5.1 than at pH 7.1.
(a) β–galactosidase activity expressed by the transcriptional fusion pQF-PpefB in S. Typhimurium Δhns::kanΔhhaΔydgT triple mutant and its complemented strains after growth in TSB-MES pH 5.1 or pH 7.1 at 37°C under standing conditions. In stationary phase, aliquots were collected for measurements of the OD600nm and β–galactosidase activity. β-galactosidase activities are expressed in Miller units. Average values (± standard error of the mean) of activity units were calculated based on at least three independent assays. For Δhns::kan and Δhns::kanΔhhaΔydgT strains, several mutants were tested in each assay. (b) Western blot against PefA or Hsp60 proteins (loading control) prepared from S. Typhimurium 14028 wild-type, ΔhhaΔydgT, Δhns::kan or Δhns::kanΔhhaΔydgT mutants grown statically at 37°C until stationary phase in TSB-MES pH 5.1 or pH 7.1. Several Δhns::kan mutants and Δhns::kanΔhhaΔydgT triple mutants were tested in each experiment. A typical result is presented for each culture condition tested. For the PefA results, the time of membrane exposure necessary to obtain the signal is mentioned. Relative intensities for PefA bands calculated using normalization with the loading control Hsp60 are noted just under the immunoblot exposed for 4 s and for which no signal saturation was detected.
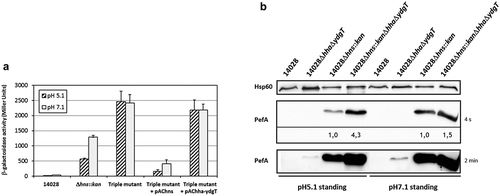
Figure 7. StpA silences PefA expression by acting on the pefB promoter.
S. Typhimurium 14028 and its derivative strains were grown statically at 37°C in TSB-MES pH 5.1 (A to D) or at 37°C in TSB-MES pH 5.1 or pH 7.1 under standing or shaking conditions (e and f). At stationary phase, cells were harvested for RT-PCR, Western blot analysis and β-galactosidase activity measurement. At least three independent assays were performed for each experiment. (a) Estimation of pefB, pefA, pefC and orf5 mRNA levels by RT-PCR. PCR were performed on mRNA samples without RT (-) or with RT (+) and prepared from S. Typhimurium wild-type, ΔstpA::kan mutant and its complemented strain. (b) Western blot against PefA or Hsp60 proteins (loading control). For the PefA results, the time of membrane exposure necessary to obtain the signal is mentioned. (c) β–galactosidase activities expressed by pQF-PpefA and pQF-PpefB transcriptional fusions in S. Typhimurium wild-type, ΔstpA::kan mutant and its complemented strain. β-galactosidase activities are expressed in Miller units. Average values (± standard error of the mean) of activity are presented. (d) Western blot against PefA or Hsp60 proteins (loading control) prepared from S. Typhimurium wild-type, ΔPpefB, ΔstpA::kan mutant and the ΔstpA::kanΔPpefB double mutant. For PefA results, the time of membrane exposure necessary to obtain the signal is mentioned. (e) Western blot against PefA or Hsp60 proteins (loading control) prepared from wild-type strain and ΔstpA::kan mutant. For the PefA results, the time of membrane exposure necessary to obtain the signal is mentioned. (f) β–galactosidase activity expressed by the transcriptional fusion pQF-PpefB in S. Typhimurium 14028 wild-type, ΔstpA::kan mutant and its complemented strain. Activities are expressed in Miller units. Average values (± standard error of the mean) of activity were calculated based on at least three independent assays.
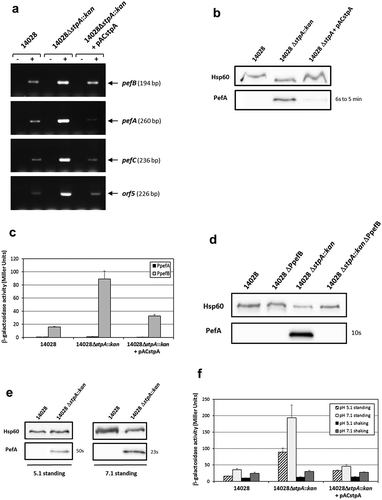
Figure 8. Model for in vitro pef regulation in S. Typhimurium.
The six ORFs belonging to the pef operon are represented by black arrows. The two promoters identified upstream of pefB and pefA are indicated by red broken arrows. The promoter upstream of pefA is repressed by H-NS and the RNA binding protein CsrA stabilizes the pefACDorf5orf6 transcript. The activity of CsrA is antagonized by the 5ʹ-UTR of the fimA-F transcript and the two small RNAs named CsrB and CsrC [Citation23]. The promoter upstream of pefB is strongly silenced by H-NS and weakly by StpA and Hha-YdgT. The two gray double arrows between H-NS and Hha-YdgT indicate that, at pH 7.1 Hha-YdgT act through H-NS to modulate pef expression, contrary to pH 5.1 where Hha-YdgT seem able to negatively regulate pef expression independently of H-NS. The single dashed double arrow with a question mark connecting StpA and Hha-YdgT signifies a possible interaction at pH 5.1 between these three NAPs to repress pef expression.
![Figure 8. Model for in vitro pef regulation in S. Typhimurium.The six ORFs belonging to the pef operon are represented by black arrows. The two promoters identified upstream of pefB and pefA are indicated by red broken arrows. The promoter upstream of pefA is repressed by H-NS and the RNA binding protein CsrA stabilizes the pefACDorf5orf6 transcript. The activity of CsrA is antagonized by the 5ʹ-UTR of the fimA-F transcript and the two small RNAs named CsrB and CsrC [Citation23]. The promoter upstream of pefB is strongly silenced by H-NS and weakly by StpA and Hha-YdgT. The two gray double arrows between H-NS and Hha-YdgT indicate that, at pH 7.1 Hha-YdgT act through H-NS to modulate pef expression, contrary to pH 5.1 where Hha-YdgT seem able to negatively regulate pef expression independently of H-NS. The single dashed double arrow with a question mark connecting StpA and Hha-YdgT signifies a possible interaction at pH 5.1 between these three NAPs to repress pef expression.](/cms/asset/52d77fcd-d108-4817-b6b4-3c4b2b2a1bb4/kvir_a_1682752_f0008_oc.jpg)
Figure 9. H-NS predicted sites and AT content of the pef operon.
The upper part of the figure shows the AT percentage along the nucleotide sequence of the pef operon. A schematic diagram of the pef operon, with the H-NS predicted sites symbolized by black triangles, is represented in the lower part of the figure. The AT content was calculated using a window length of 25 bp. Potential H-NS binding sites in pef operon were searched using the Virtual Footprint software [Citation72] and the H-NS position weight matrix from E. coli [Citation61]. Only the sites with a score greater than 5.5 are indicated, while the maximum score for this matrix is 6.73. The experimentally identified PpefB and PpefA promoters are indicated by broken arrows.
![Figure 9. H-NS predicted sites and AT content of the pef operon.The upper part of the figure shows the AT percentage along the nucleotide sequence of the pef operon. A schematic diagram of the pef operon, with the H-NS predicted sites symbolized by black triangles, is represented in the lower part of the figure. The AT content was calculated using a window length of 25 bp. Potential H-NS binding sites in pef operon were searched using the Virtual Footprint software [Citation72] and the H-NS position weight matrix from E. coli [Citation61]. Only the sites with a score greater than 5.5 are indicated, while the maximum score for this matrix is 6.73. The experimentally identified PpefB and PpefA promoters are indicated by broken arrows.](/cms/asset/6060bbef-d1e7-4e92-ab12-ee5b3e384003/kvir_a_1682752_f0009_b.gif)
Table 1. Strains and plasmids used in this study.