Figures & data
Figure 1. (a): Multiple sequence alignment of DLDs from Vibrio spp. The GenBank accession numbers are as follows: DLDs of Vibrio fischeri WP_069594165.1, Vibrio splendidus (DLD1) WP_010435969.1, Vibrio splendidus (DLD2) WP_004729673.1, Vibrio campbellii WP_012128871.1, Vibrio coralliilyticus WP_006958123.1, Vibrio parahaemolyticus WP_021823119.1, Vibrio alginolyticus AGK62253.1, Vibrio mimicus WP_000031532.1, Vibrio cholerae WP_000031535.1, Vibrio anguillarum WP_013857673.1, Vibrio vulnificus RAH35251.1, Vibrio fluvialis WP_020430460.1. (b and c) showed the domains of DLD1 and DLD2.
Figure 2. Unrooted phylogenetic tree of DLDs from different Vibrio spp. constructed using MEGA 5.0 software. The scale bar represents a distance of 0.1 substitutions per site. The tree was obtained by bootstrap analysis with a neighbor-joining method, and numbers on branches represent bootstrap values for 1000 replications.
Figure 3. (a): the SDS-PAGE analysis of the recombinant proteins of DLD1 (lane 1) and DLD2 (lane 2), and M is the Marker (kDa). (b): the absorbance at OD340 after the reaction was catalyzed by DLD1 or DLD2. The reaction without DLD1 or DLD2 was used as a control (NC). Data are the means of three independent experiments, and are presented as means ± SD.
Figure 4. Determination of DLDs location using whole cell ELISA. The same amount of cells was used as antigen to react with DLD1 or DLD antibody 2. The developed color was measured at 450 nm. (a): a, the cells blocked by DLD1 antibody; b, the negative group; c, the cells blocked by DLD2 antibody; d, the negative group; e, the control group. (b): The absorbance at OD450 of the control group, negative group, V. splendidus reacted with DLD1 antibody and V. splendidus reacted with DLD2 antibody. Data are the means of three independent experiments, and are presented as means ± SD. *P< 0.05, **P< 0.01.
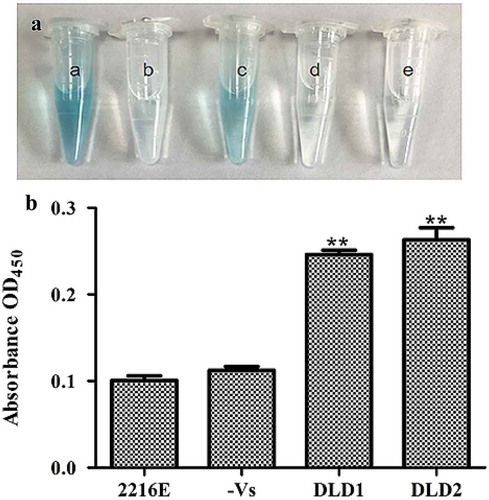
Figure 5. The adhesive ability of V. splendidus to polystyrene demonstrated by fluorescence (a-c) and colony counting (d). The green fluorescence was generated by the labeled Vs-DTAF. a, the cells blocked by DLD1 antibody; b, the cells blocked by DLD2 antibody; c, the control group; d, quantity of the cells that adhered to polystyrene. From the left to right: V. splendidus treated with DLD1 antibody, V. splendidus treated with DLD2 antibody, and V. splendidus.
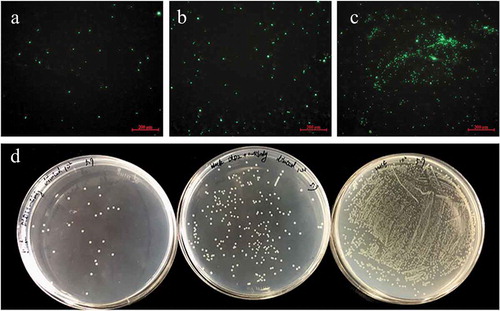
Figure 6. The adhesive ability of V. splendidus to coelomocytes demonstrated by fluorescence (a-c) and colony counting (b). The green fluorescence was the labeled Vs-DTAF and the red fluorescence was the labeled coelomocyte. (a), the cells blocked by DLD1 antibody; (b), the cells blocked by DLD2 antibody; (c), the control group. (d), Colony counting of the cells that adhered to coelomocytes. After adhesion and washes, the resuspesion cell solution was 1.0 × 10³-fold dilution, and 50 μL was spread on 2216E plate. Data were means of three independent experiments, and are presented as means ± SD. *P< 0.05, **P< 0.01.
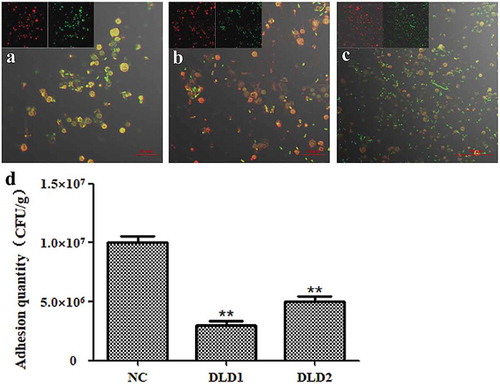
Figure 7. The adhesive ability of V. splendidus to different tissues of A. japonicus. The tissues of body wall, tentacle, muscle, respiratory tree, and intestine of A. japonicus specimens were collected and homogenized after 24 h immersion infection. The homogenate was 1.0 × 10³-fold diluted and 50 μL was spread on 2216E plate. (a): the cells blocked by DLD1 antibody; (b): the cells blocked by DLD2 antibody; Data are means of three independent experiments, and are presented as means ± SD. *P < 0.05, **P< 0.01.