Figures & data
Table 1. Bacterial strains, plasmids, and primers used in this study.
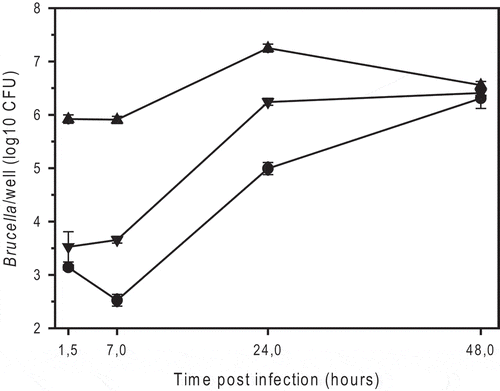
Figure 1. Intracellular replication of smooth B. microti CCM4915T (triangle down), the spontaneous rough mutant of B. microti (BmRSM; triangle up), and smooth B. suis 1330 (circle), in murine J774A.1 macrophage-like cells. The number of colony forming units (CFU) was determined by plating serial dilutions on TS agar plates after 2 or 3 days of incubation at 37°C for B. microti and B. suis, respectively. The experiments were performed three times in triplicate each. Data are presented as mean values ± SD of one experiment (in triplicate).

Table 2. Balb/c mice liver and spleen colonization by B. microti S and RSM strains 3 days post-inoculation.
Figure 2. Atomic Force Microscopy (AFM) images of B. microti wild-type (Bm WT), ΔwbkE mutant (Bm RΔwbkE) and the complemented ΔwbkE mutant (Bm RΔwbkE compl). (a) Each column shows from top to bottom the vertical deflection image (height) of the whole bacteria and 0.3 × 0.3 µm2 areas of the cell surface, representing roughness and adhesion recorded on the shown bacteria (blue square). Quantitative roughness (b) and adhesion (c) measurements of Bm WT, Bm RΔwbkE and complemented Bm RΔwbkE: 0.5 × 0.5 µm2 images were recorded and used for measurements of 0.25 × 0.25 µm2 areas to quantify arithmetic roughness Ra and adhesion (Peak-to-Valley). n = 9 bacteria/strain. Statistical differences were analyzed by t-test and yielded P values < 0.001 when comparing Bm WT or Bm RΔwbkE compl with Bm RΔwbkE. Image analysis was done with Gwyddion [Citation34].
![Figure 2. Atomic Force Microscopy (AFM) images of B. microti wild-type (Bm WT), ΔwbkE mutant (Bm RΔwbkE) and the complemented ΔwbkE mutant (Bm RΔwbkE compl). (a) Each column shows from top to bottom the vertical deflection image (height) of the whole bacteria and 0.3 × 0.3 µm2 areas of the cell surface, representing roughness and adhesion recorded on the shown bacteria (blue square). Quantitative roughness (b) and adhesion (c) measurements of Bm WT, Bm RΔwbkE and complemented Bm RΔwbkE: 0.5 × 0.5 µm2 images were recorded and used for measurements of 0.25 × 0.25 µm2 areas to quantify arithmetic roughness Ra and adhesion (Peak-to-Valley). n = 9 bacteria/strain. Statistical differences were analyzed by t-test and yielded P values < 0.001 when comparing Bm WT or Bm RΔwbkE compl with Bm RΔwbkE. Image analysis was done with Gwyddion [Citation34].](/cms/asset/21e5c724-6a16-4bb1-923d-9d94708bb74c/kvir_a_1682762_f0002_oc.jpg)
Table 3. Phenotypes of S and R strains of B. microti and B. suis.
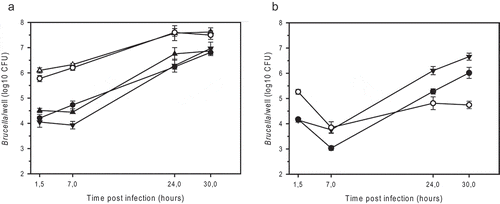
Figure 3. Intracellular replication of smooth and rough strains of B. microti (a) and B. suis (b) in murine J774A.1 macrophage-like cells. (a) B. microti CCM4915T wild-type (filled triangle down), the spontaneous R-strain BmRSM (open triangle up), the complemented BmRSM mutant (filled triangle up), the constructed R-strain BmRΔwbkE (open circle), and the complemented BmRΔwbkE mutant (filled circle). (b) B. suis 1330 wild-type (filled triangle down), the constructed R-strain BsRΔwbkE (open circle), and the complemented BsRΔwbkE mutant (filled circle). The complemented strains expressed native wbkE cloned into the replicative plasmid pBBR1MCS. The experiments were performed three times in triplicate each. Data are presented as mean values ± SD of one experiment (in triplicate).

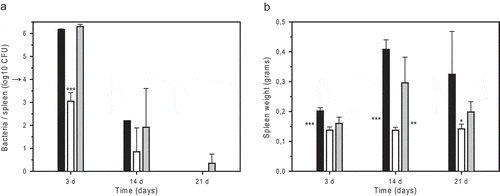
Figure 4. Infection of Balb/c mice with B. microti strains: growth and survival of B. microti strains in the spleen (a) and spleen weights of infected animals (b) after i.p. inoculation of 104 bacteria. The number of viable B. microti CCM4915T wild-type (black bars), BmRΔwbkE strain (open bars), and complemented BmRΔwbkE mutant (grey bars) was determined at days 3, 14, and 21 post-infection. The arrow indicates the infection dose of 104 bacteria. Five mice were sacrificed per bacterial strain and time point, and values represent means ± SD. Asterisks indicate variable significance of the differences between the R-strain and the wild-type (next to left bar) or R-strain and the complemented mutant (next to right bar), or between the R-strain and both the wild-type and the complemented mutant (above middle bar): * P < 0.05; ** P < 0.005; *** P < 0.001.

Table 4. Lethality of B. microti S and R strains in Balb/c mice
