
Figures & data
Figure 1. Schematic representation of sputum collection and sample processing, storage and analysis. (a) Image of sputum collection from a mechanically ventilated patient. A mechanical ventilation machine [1] supplies the intubated patient [2] with warm humidified air. Sputum is collected by attaching an external collection tube [3] to a tube (4a-b) that is connected to the intubation tube. The tube on the other end [5] of the collection tube is connected to a vacuum pump. The vacuum can be applied to this closed system by pressing a button (4a), and the tube for sputum collection (4b) is then inserted into the patient’s lungs. Some saline [6] can simultaneously be introduced into the lung to ease the sputum extraction. (b) Schematic representation of the workflow following sputum collection. The collected sputum is (i) processed for storage and further analyses (i.e. spotting on indicator bacteria, determination of residual antibiotics and 16S rRNA analysis), and (ii) plated for collection of microorganisms present in the sputum and subsequent assessment of the production of antimicrobial agents (i.e bacteriocins) by spotting on plates with indicator bacteria.
![Figure 1. Schematic representation of sputum collection and sample processing, storage and analysis. (a) Image of sputum collection from a mechanically ventilated patient. A mechanical ventilation machine [1] supplies the intubated patient [2] with warm humidified air. Sputum is collected by attaching an external collection tube [3] to a tube (4a-b) that is connected to the intubation tube. The tube on the other end [5] of the collection tube is connected to a vacuum pump. The vacuum can be applied to this closed system by pressing a button (4a), and the tube for sputum collection (4b) is then inserted into the patient’s lungs. Some saline [6] can simultaneously be introduced into the lung to ease the sputum extraction. (b) Schematic representation of the workflow following sputum collection. The collected sputum is (i) processed for storage and further analyses (i.e. spotting on indicator bacteria, determination of residual antibiotics and 16S rRNA analysis), and (ii) plated for collection of microorganisms present in the sputum and subsequent assessment of the production of antimicrobial agents (i.e bacteriocins) by spotting on plates with indicator bacteria.](/cms/asset/6ee5177d-ca0e-47a4-8d99-9a66e7093198/kvir_a_1682797_f0001_oc.jpg)
Table 1. Baseline characteristics and clinical variables of included ICU patients (n = 53).
Figure 2. Detection of antimicrobial activity in sputa. 125 sputum samples from 56 different patients were spotted on blood agar plates with confluent lawns of the indicator bacteria S. pneumoniae TIGR4, S. anginosus 009–1 and S. aureus HG001. The antimicrobial activity in particular sputa is depicted by cleared zones of growth inhibition. Of note, this assay was performed before completion of the analysis of patient data. Since three patients were subsequently excluded from the study (see materials and methods), the results for the six respective sputum samples (G4, H5-6, K7-8 and L1) are covered in the image. One sputum sample (F4) could not be applied to the plates, because the sputum sample was too viscous for quantitative spotting; for two other samples the results are covered (E8, F7), because insufficient amounts of sputum were available to test them against all three species of indicator bacteria. The topography of sputum samples spotted onto lawns of the indicator bacteria is described in Supplemental Table S2.
Figure 3. Pneumococcal growth inhibition related to administered antibiotics or actual cefotaxime concentrations in collected sputum samples. (a) Scatter plot of pneumococcal growth inhibition versus the intravenously administered antibiotics as detailed in Supplemental Table S1. The median inhibition is shown behind the (combination of) antibiotics on the Y-axis. (b) Scatter plot of pneumococcal growth inhibition versus the measured cefotaxime concentration in sputum. The red dashed line indicates the MIC of cefotaxime for S. pneumoniae TIGR4. Note that several samples with cefotaxime concentrations above the MIC for S. pneumoniae TIGR4 show no growth inhibition, whereas other samples with cefotaxime concentrations lower than the MIC for S. pneumoniae TIGR4 show strong pneumococcal growth inhibition. Importantly, cefotaxime was only measured in samples from patients who received cefotaxime as monotherapy during ICU admission.
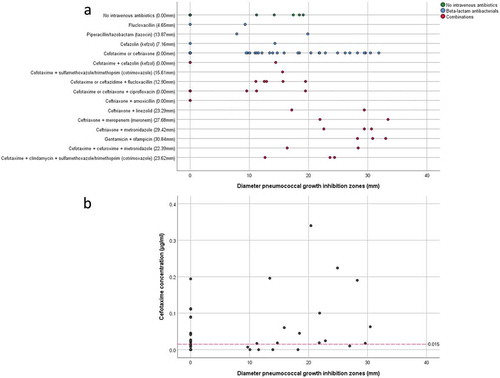
Figure 4. Antagonistic actions between bacterial sputum isolates and indicator bacteria. 14 microbial isolates from seven sputum samples of three different patients were spotted on blood agar with confluent lawns of the indicator bacteria S. pneumoniae TIGR4, S. anginosus 009–1 and S. aureus HG001. Note that none of the spotted isolates caused growth inhibition of the indicator bacteria, whereas S. aureus HG001 did inhibit growth of some of the spotted isolates. The topography of bacterial samples spotted onto lawns of the indicator bacteria is detailed in Supplemental Table S5.
Figure 5. Heatmap of microbial abundance in sputum. The heatmap was generated based on a hierarchical clustering solution (Euclidean distance metric and average linkage) of the sputum microbiome samples (n = 27). Rows represent species identified by 16S rRNA sequencing, and columns represent individual sputum samples. The heatmap is sorted according to the dendogram analyses, based on the relative abundance of particular species. The color key for relative abundance of the different species is presented on the right of the heatmap. Positive and negative controls were performed, but the respective results are not presented in the heatmap. The panels below the heatmap present the detected antimicrobial activity in each sputum sample (in mm; color-coded in accordance with the key on the right), and selected patient characteristics relating to (antimicrobial) therapy in the ICU, lung diseases and ICU survival (black indicates “yes”). Importantly, information in the latter panel is shown per sample. An additional bar plot of the microbial abundance per sputum sample is shown in Supplemental Figure S1, and a heatmap of the microbial abundance in sputum samples related to the respective antimicrobial activity against the indicator strain S. pneumoniae TIGR4 is presented in Supplemental Figure S3.
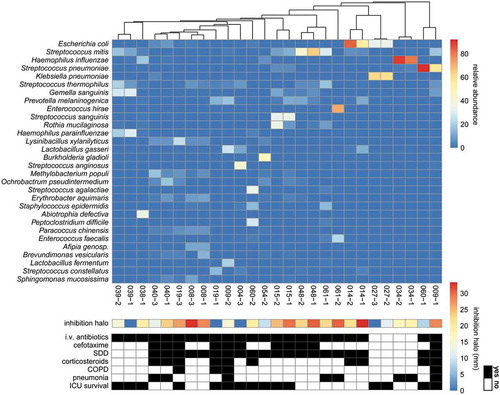
Table 2. Comparison of patient characteristics and antimicrobial activity against S. pneumoniae TIGR4 in sputum samples in relation to pneumonia and ICU survival.