Figures & data
Figure 1. Defensin 1 significantly delays the growth of S. pneumoniae D39 and of multi-resistant S. pneumoniae as a function of concentration. S.p. were grown to an Optical Density (OD) 600nm of 0.4 in Todd Hewitt Yeast Medium. Upon dilution to OD600nm = 0.01, S.p. D39 were incubated with declining amounts of Defensin 1 (25 µM, 12.5 µM, 6.25 µM, 3.125 µM) at 37°C with 5% CO2. OD600nm was measured at 30 min intervals (a). The multi-resistant S.p. (AMR) were incubated with declining amounts of Defensin 1 (25 µM, 12.5 µM, 6.25 µM, 3.125 µM) under the same conditions (b). OD600nm was measured at 30 min intervals. Bacterial growth of D39 (c) and the AMR strain (d) was monitored by colony forming unit assay. S.p. were grown and diluted as in (a) and (b). Statistical significance was assessed by two-way Anova, compared to corresponding control. **p < 0.01, ****p < 0.0001.
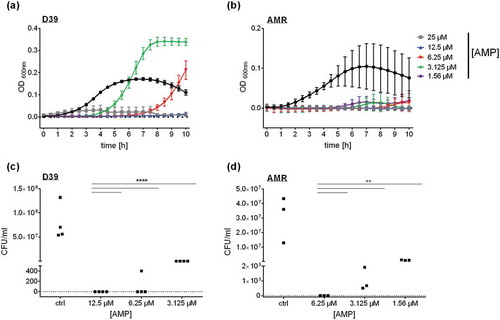
Figure 2. Defensin 1 has low cytotoxic impact on blood derived macrophages. After incubation of BDM with specified concentrations of Defensin 1 for either 24 or 48 hours, cytotoxicity was measured by LDH-Assay. Values were calculated based on 100% total lysis. Statistical significance was assessed by one-way Anova vs. lowest dose of AMP.
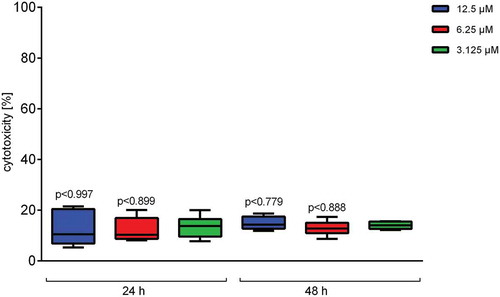
Figure 3. Defensin 1 leads to reduced cytokine mRNA expression in S.p. infected BDMs. 12.5 µM (MIC) and 6.25 µM of Defensin 1 lead to significantly less IL-1β mRNA (a) and IL-8 mRNA (b) expression for all MOIs and timepoints. 1.25 µM AMP showed no differences in interleukin expression compared to control (-). Log2 transformed data are shown. Statistical significance was assessed by two-way Anova, ####p < 0.0001 (12.5 µM vs. corresponding control), ****p < 0.0001 (6.25 µM vs. corresponding control.).
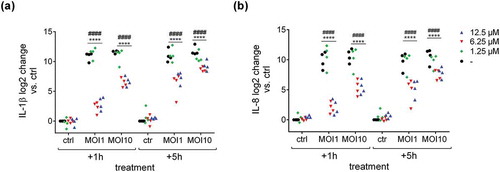
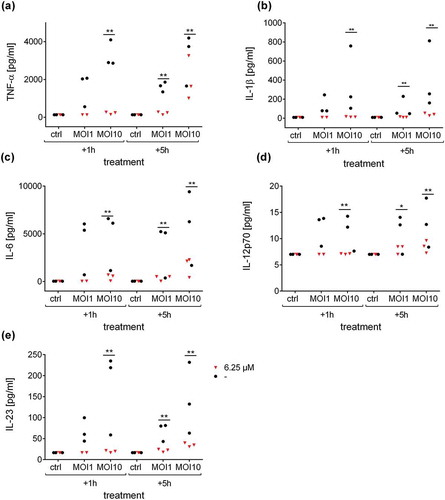
Figure 4. Defensin 1 reduces cytokine release from infected human macrophages. Supernatants from samples in were analyzed by Multiplex ELISA for different cytokines. Secretion levels of TNF-α (a), IL-1β (b), IL-6 (c), IL-12p70 (d) and IL-23 (e) after treatment with 6.25 µM Defensin 1 for 1 h or 5 h post infection, respectively, or left untreated for control (-) are shown. Statistical significance was assessed as described in the methods section, **p < 0.01, *p < 0.05 vs. corresponding control.