Figures & data
Figure 1. Survival rates of fungal sepsis mice. Survival rates between WT+CA, lck-mTOR+CA, and lck-TSC1+ CA mice. Survival rates were observed every 2 h in the first 12 h after Candida injection and then observed every 6 h. n = 20–25 mice per group. p < 0.05 was significant, analyzed by log-rank test. Median survival time of WT+CA was 100h. CA = Candida albicans; WT = wild type.
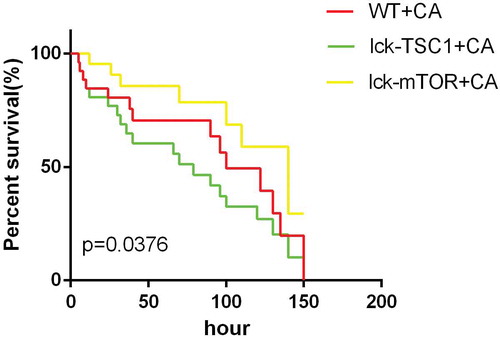
Figure 2. Severe invasive C. albicans multiple organs infection mouse model was successfully constructed. Representative kidney (a), lung (b), spleen (c) and liver (d) histological sections from 12 h post-infection were stained with GMS to visualize C. albicans hyphae and spores. Black arrows indicate hyphae; black arrowhead indicates a spore. Magnification, 400 × .
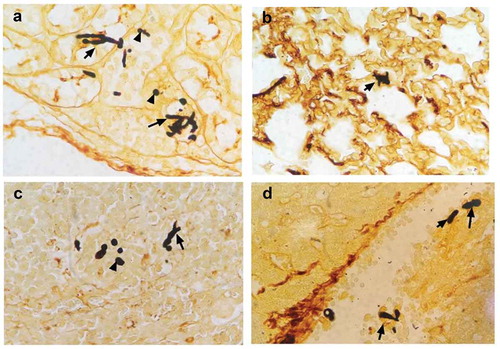
Figure 3. mTOR pathway activation was elevated in fungal sepsis mice compared with uninfected control mice. (a, b) mTOR and TSC1 RNA levels in CD4+ T cells. PCR amplification of mTOR (a) and TSC1 (b) RNA from sorted CD4+ T cells in WT, lck-mTOR and lck-TSC1 mice, respectively. (c–e) Protein levels of p-mTOR and p-P70S6 in CD4+ T cells. Levels of p-mTOR and p-P70S6 in CD4+ T cells were quantified by western blotting. The amount of each protein level was normalized by GAPDH. Mean ± SD, six mice per group, ∗p < 0.05, ∗∗∗∗p < 0.0001.
Figure 4. Autophagy process in CD4+ T cells in fungal sepsis. (a–d) Autophagy protein expression FACS profiles of LC3B and p62/SQSTM1 staining of CD4+ T cells from WT, WT+CA, lck-mTOR+control, lck-mTOR+CA, lck-TSC1+ control or lck-TSC1+ CA mice at 12 h after the procedure. Representative data are shown in A and C. B and D show the MFI of LC3B and p62 staining in CD4+ T cells. (e) Ultrastructural features of autophagy vacuoles in CD4+ T cells. Autophagy flux was investigated using TEM. (Ea) In control mice, CD4+ T cells were normal in appearance, revealing moderate autophagy vacuoles (asterisk) in the cytosol with double- or single-membrane structures containing digested cytoplasmic components. (Eb) WT+CA mice displayed increased autophagic vacuolization. (Ec) Lck-mTOR+CA mice showed more autophagic vacuolization (red arrows) and larger autolysosomes (black arrows). (Ed) Lck-TSC1+ CA mice displayed fewer autophagic vacuoles. Mean ± SD. Six mice per group, ∗∗∗∗p < 0.0001. MFI = mean fluorescence intensity.
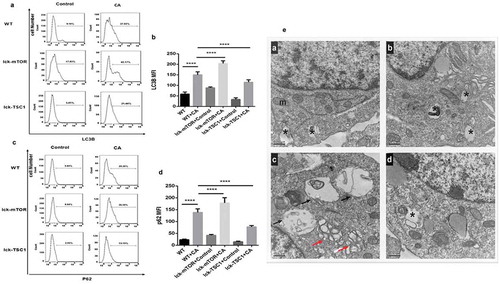
Figure 5. CD4+ T cell counts in Candida-infected mice. Splenocytes were obtained at 12 h after Candida injection. (a) Gating strategy for CD4+CD8− and CD4−CD8+ T cells by flow cytometry analysis. (b) CD4+ T cell count for each specimen. Mean ± SD, six mice per group, ∗p < 0.05, ∗∗∗∗p < 0.0001.
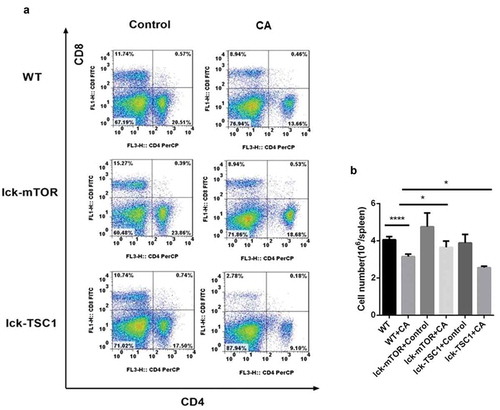
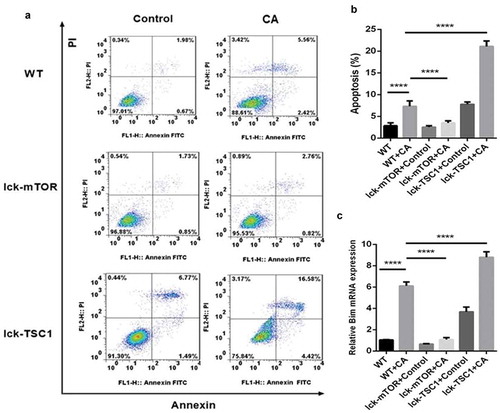
Figure 6. Evaluation of apoptosis in CD4+ T cells in fungal sepsis. (a) The subpopulation of annexin-V-positive and PI-negative stained CD4+ T cells was considered to be undergoing early apoptosis, while the subpopulation of annexin-V-positive and PI-positive stained CD4+ T cells was considered to be undergoing late apoptosis. (b) The apoptosis rate of CD4+ T cells, as analyzed by ratio of annexin-V-positive and PI-positive/negative stained CD4+ T cells. (c) Relative RNA expression for the apoptotic gene BIM. Mean ± SD, six mice per group, ∗∗∗∗p < 0.0001.