Figures & data
Figure 1. Circular graph of V. mimicus strain SCCF01 genome. Rings from the outermost to the center: (1) scale marks of the genome; (2) protein-coding genes on the forward strand; (3) protein-coding genes on the reverse strand; (4) tRNA (black) and rRNA (red) genes on the forward strand; (5) tRNA (black) and rRNA (red) genes on the reverse strand; (6) GC content; (7) GC skew. Protein-coding genes are color-coded according to their COG categories
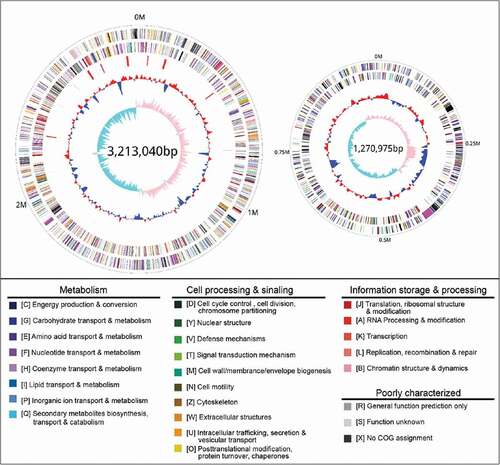
Table 1. The results of sequencing and assembly
Table 2. Virulence factors of V. mimicus strain SCCF01
Table 3. Repeat elements prediction in V. mimicus strain SCCF01
Figure 2. Genomic islands (GI) prediction in V. mimicus SCCF01 by IslandViewer; A: Chromosome I (Chr.I), Chromosome II (Chr.II)
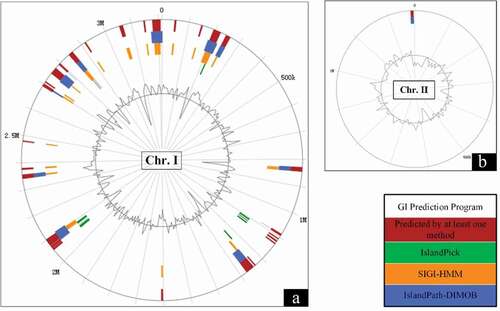
Figure 3. Schematic diagram of prophage organization
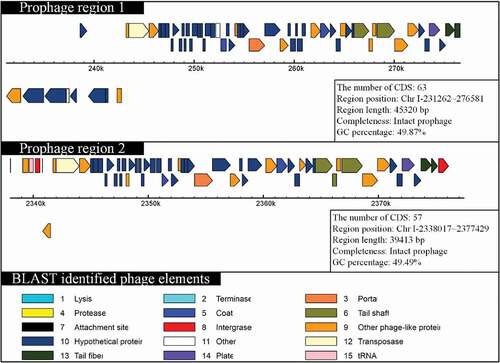
Figure 4. Linear pairwise comparison of the SCCF01 strain genome
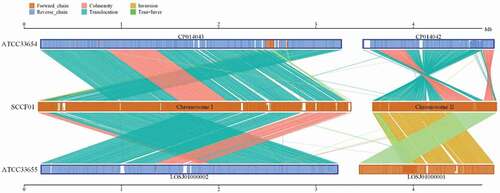
Table 4. The result of gene family analysis
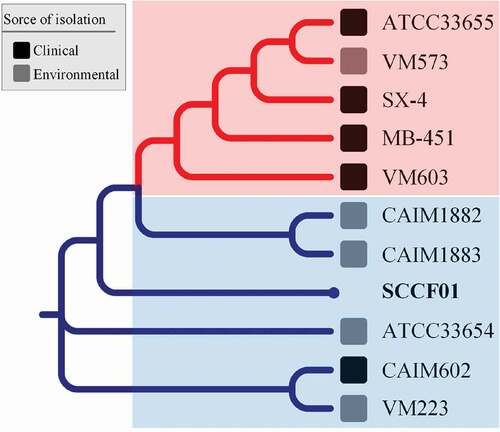
Figure 5. Phylogenetic tree of Vibrio mimicus based on locally collinear block searching