Figures & data
Table 1. The occurrence of tax protein variants in each subgroup of cows: BLV+ I, BLV+ I/II and BLV+ II are BLV- positive subgroups of animals
Table 2. Unpaired t-test results for groups and subgroups of cows. The two-tailed P values with a 95% confidence interval. WBC RI (the WBC reference interval) has been measured in WBC/µL. BLV -, BLV +, BLV+ I, BLV+ I/II, and BLV+ II areas in and . BLV- and BLV + status has been determined by both serology (AGID) for BLV antibody, and PCR detection of proviral BLV DNA
Figure 1. ANOVA test results for BLV-negative (BLV-), BLV-positive (BLV+) groups, I-st BLV-positive (BLV+ I), I/II-nd BLV-positive (BLV+ I/II) and II-nd BLV-positive (BLV+ II) subgroups of cows. The number of WBCs (y × 103 cells/μL) is on the y-axis. BLV- and
Table 3. Tax protein sequences have been used for the alignment () and the phylogenetic analysis (). PL, T, AL, EBL*, EBL areas in ,
Figure 2. Alignment of Tax amino acid sequences./ – \― structural domains, + ― phosphorylation sites. BLV+ I, BLV+ I/II and BLV+ II areas in . PL ― Persistent Lymphocytosis, T ― tumor (B-cell leukemia/lymphoma), AL ― aleukemic (asymptomatic, healthy or non-EBL), EBL* ― the disease has developed during the observation period (AL → EBL), EBL ― Enzootic Bovine Leukosis (PL or T are unknown) ()
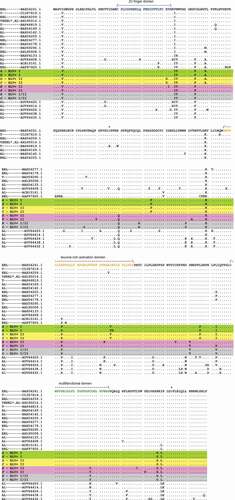
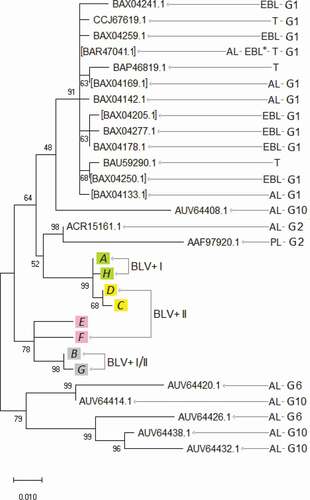
Figure 3. Tax primary protein sequence evolutionary analysis by Maximum Likelihood method. The percentage of trees in which the associated sequences clustered together is shown next to the branches. BLV+ I, BLV+ I/II, BLV+ II, PL, T, AL, EBL*, EBL areas in , . G1, G2, G6, and G10 ― BLV genotypes, based on env genes and complete proviral genomic sequences, for which references are given in . Square brackets indicate the sequence numbers that represent groups of identical ones ()