Figures & data
Table 1. Oligos used in vector construction and RT-qPCR assay and RNA interference
Figure 1. ZIKV infects CCF-STTG1 cells in vitro and astrocytes in the brain of AG6 mice in vivo. (a) CCF-STTG1 cells were infected with ZIKV at an MOI of 3 (TCID50/cell). Subsequently, 24-h post-infection, the cells were used for immunofluorescence analysis. The experiment was repeated three times. ZIKV-E (red), DAPI (blue).10×; (b) Sagittal sections of the brains of AG6 mice on day 5 post-infection. Three mice per group were perfused and paraffin-embedded. GFAP (green), ZIKV-E (red), DAPI (blue).48.4× magnification.(Bar = 50 μm)
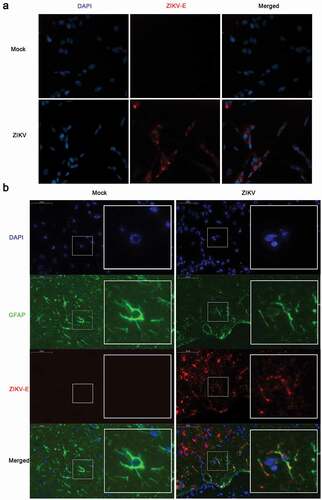
Figure 2. ZIKV promotes CCN1 expression in CCF-STTG1 cells and in mouse brain astrocytes. (a) and (b) MOI = 3TCID50/cell. Double standard curve method was used for RT-qPCR. The formula of the standard curve is as follows: human-gapdh y = −0.240x + 10.99, human-ccn1 y = −0.221x + 10.27, ZIKV RNA y = −0.272x + 10.96. (a) Expression profiles of ZIKV RNA in intra- and culture supernatant CCF-STTG1 cells. (b) Expression profiles of CCN1mRNA post-infection in CCF-STTG1 cells. (c) Expression profiles of CCN1 and ZIKV-E protein in CCF-STTG1 cells. (d) Expression profiles of ZIKV RNA and CCN1 mRNA in the brain of mice. On days 2 and 5 post-infection, the whole brain of ZIKV-infected mice and mock-treated mice were stripped and total RNA were extracted and analyzed using RT-qPCR (double standard curve method). The formula of the standard curve is as follows: mouse-gapdh y = −0.3025x + 11.048, mouse-ccn1 y = −0.2234x +10.124, ZIKV RNA y = −0.2721x + 10.966. (e) Immunofluorescence staining of CCN1 and GFAP in the brain of mice. CCN1 (red), GFAP (green), DAPI (blue). (Bar = 50 μm). Each experiment was repeated three times. Statistical analyses were performed using GraphPad Prism 6.0 software. Data are expressed as the mean ± standard deviation (SD) (*, P < 0.05; **, P < 0.01; ***, P < 0.001)
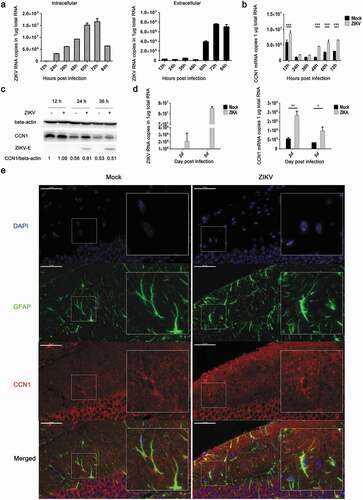
Figure 3. CCN1 promotes ZIKV replication in CCF-STTG1 cells. (A&B) CCN1, NS-CCN1, and pcDNA3.1(+) were transfected in CCF-STTG1 cells, separately. Subsequently, 6 h post-transfection, the cells were infected with ZIKV (MOI = 3TCID50/cell). Cells and supernatants were harvested 60 h post-infection. (a) Intracellular CCN1 mRNA levels were measured by RT-qPCR analysis (comparative delta–delta Ct). b) Intracellular and extracellular ZIKV RNA levels were measured by RT-qPCR analysis (comparative delta–delta Ct). (c) CCF-STTG1 cells were transfected with CCN1 or NS-CCN1 expression plasmids, and subsequently infected with ZIKV (MOI = 3 (TCID50/cell)), and cell lysates were harvested 24 h post-infection. The CCN1 and ZIKV-E protein level relative to beat actinin three experiments were summarized in the bar graph below. (d)&(e) CCF-STTG1 cells were infected with ZIKV for 2 h, followed by the addition of 1 µg or 2 µg of H-78 in the culture supplied with 1.5-mL complete medium. (d) CCF-STTG1 cells were harvested 36 h post-infection for western blot. Densitometry from ZIKV E blots normalized for beta-actin were labeled below the blots (e) CCF-STTG1 cells were harvested 36 h post-infection for RT-qPCR. Double standard curve method was used for RT-qPCR. The formula of the standard curve is as follows: human-gapdh y = −0.438x + 14.02, human-ccn1 y = −0.262x + 10.90, ZIKV RNA y = −0.243x + 10.42. Each experiment was repeated three times. Statistical analyses were performed using GraphPad Prism 6.0 software. Data are expressed as the mean ± standard deviation (SD) (*, P < 0.05; **, P < 0.01; ***, P < 0.001)
Figure 4. NS3 protein of ZIKV activates the CRE in the CCN1 promoter and induces CREB phosphorylation and CCN1 expression. (a) and (b) CCF-STTG1 cells were infected with ZIKV or UV-ZIKV for 2 h. (a) Cells were harvested 24 h post-infection for western blot analysis. (b) Cells were harvested 12 h post-infection for RT-qPCR analysis. Densitometry from CCN1 blots normalized for beta-actin were labeled below the blots. Double standard curve method was used for RT-qPCR. The formula of the standard curve is as follows: human-gapdh y = −0.438x + 14.02, human-ccn1 y = −0.262x + 10.90, ZIKV RNA y = −0.243x + 10.42. (c) HEK293T cells were grown to 40–50% confluence in 12-well plates and co-transfected with 1500 ng of pCAGGS-Flag-NS, 250 ng of p-2299, and 50 ng of pRL-TK using ProFection calcium phosphate reagents. Subsequently, 24–48 h post-transfection, the cells were collected for luciferase detection. (d) Diagram of series CCN1 promoter mutant containing various cis-elements. (e) HEK293T cells were grown in 12-well plates and co-transfected with 1500 ng of pCAGGS-Flag-NS3, 250 ng of p-2299, p-2001, p-895, p-409, p-40 or p-CRE-mut, and 50 ng of pRL-TK using ProFection calcium phosphate reagents. Subsequently, 24–48 h post-transfection, the cells were collected for luciferase detection. (f) CCF-STTG1 cells were transfected with 2000 ng Flag-NS3 per well in a 6-well plate using LipofectamineTM 3000. The cells were subsequently harvested for western blot at 24 h post-transfection.The relative p-CREB and CCN1 protein levelin three experiments were summarized in the bar graph on the right. Each experiment was repeated three times. Statistical analyses were performed using GraphPad Prism 6.0 software. Data are expressed as the mean ± standard deviation (SD). (*, P < 0.05; ***, P < 0.001)
Figure 5. Phosphorylation of CREB Ser133 affects CCN1 expression and ZIKV replication. (a) CCF-STTG1 cells were infected with ZIKV at MOI = 3 TCID50/celland harvested 6 h post-infection for western blot. Densitometry ratioofp-CREB blots toCREB were labeled below the blots (b) CCF-STTG1 cells were infected with ZIKV in the presence of the inhibitor SGC-CBP30 (1 µM), washed with 1× PBS, and placed in RPMI-1640 medium with 10% FBS containing 1-µM SGC-CBP30. The cells were harvested 24 h post-infection for western blot. The relative CCN1 protein level in three experiments were summarized in the bar graph on the right and expressed as mean ± S.D (c) On day 5 post-infection, the brain was stripped and analyzed by immunofluorescence staining. GFAP (green), p-CREB (red), DAPI (blue). (Bar = 50 μm). Each experiment was repeated three times. Statistical analyses were performed using GraphPad Prism 6.0 software. Data are expressed as the mean ± standard deviation (SD). (***, P < 0.001)
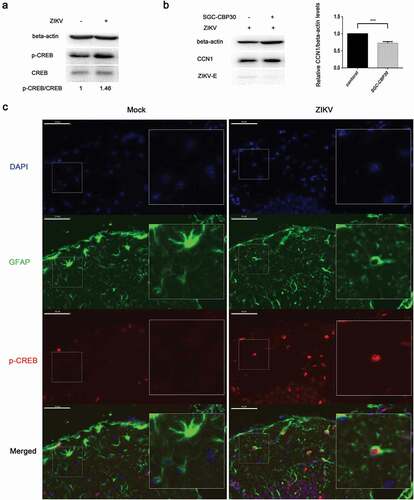
Table 2. Partial mass spectrometry results for TAP-tagged ZIKV NS3
Figure 6. NS3 binds to the regulatory domain of CaMKIIα to enhance phosphorylation at Thr286. (a) HEK293T cells were co-transfected with 3000 ng HA-CaMKIIα and 3000 ng Flag-NS3 or Flag-NS5 in 60-mm dishes using ProFection calcium phosphate reagents. The cells were harvested for Co-IP experiments 28 h post-transfection. (b) CCF-STTG1 cells were transfected with 2000 ng Flag-NS3 per well in a 6-well plate using LipofectamineTM 3000. These cells were harvested for western blot 24 h post-transfection. The relative level of p-CaMKIIα in three experiments were summarized in the bar graph on the right and expressed as mean ± S.D . (c) The schematic map of a series of HA-CAMKIIα mutants was shown. (d) HEK293T cells were co-transfected with 1500 ng HA-CaMKIIα or CaMKIIα mutant and 1500 ng Flag-NS3 using ProFection calcium phosphate reagents. The cells were subsequently harvested for Co-IP experiments 28 h post-transfection (*, HA-CaMKIIα specific band; the other band is the antibody heavy chain). Control is pcDNA3.1(+), 1 is HA-CAMKIIα 1–478, 261 is HA-CAMKIIα mutant 261–478, 280 is HA-CAMKIIα mutant 280–478, 301 is HA-CAMKIIα mutant 301–478, 315 is HA-CAMKIIα mutant 315–478, 341 is HA-CAMKIIα mutant 341–478. Each experiment was repeated three times. (*, Flag-NS3 specific band; **, HA-CaMKIIα specific band; ***, Flag-NS3 specific band; the other band is the Flag antibody heavy chain)
Figure 7. NS3 in cooperation with CaMKIIα activates CRE and up-regulates CCN1 transcription. (a) The pcDNA3.1(+) (900 ng) and pCAGGS-Flag (800 ng) (as a control) or HA-CaMKIIα (900 ng) and Flag-NS3 (800 ng) or HA-CaMKIIα (900 ng) and pCAGGS-Flag (800 ng), together with pRL-TK, and p-2299 or p-409 were co-transfected into HEK293T cells using ProFection calcium phosphate reagents. Subsequently, 48 h post-transfection, double luciferase assays were performed. The results were presented as Relative Luciferase Activity (firefly luciferase activity/renilla luciferase activity). (b) Various doses of HA-CaMKIIα, 1000-ng Flag-NS3, p-409, and pRL-TK were transfected into HEK293T cells using ProFection calcium phosphate reagents. The cells were harvested 24 h post-transfection for dual reporter luciferase assays. The results were presented as Relative Luciferase Activity (firefly luciferase activity/renilla luciferase activity). (c) Various doses of HA-CaMKIIα and 1000-ng Flag-NS3 were used for transient transfection into CCF-STTG1 cells using LipofectamineTM 3000 reagent. The cells were harvested 24 h post-transfection for RT-qPCR (comparative delta–delta Ct). Each experiment was repeated three times. Statistical analyses were performed using GraphPad Prism 6.0 software. Data are expressed as the mean ± standard deviation (SD)(*, P < 0.05; **, P < 0.01; ***, P < 0.001)
Figure 8. CaMKIIα regulates CREB Ser133 phosphorylation and affects CCN1 expression and ZIKV replication. (a) CCF-STTG1 cells were seeded in 35-mm dishes. After 16–18 h of culture, the cells were infected with ZIKV (MOI = 3) for 2 h. The cells were harvested 6 h or 36 h post-infection for western blot. Densitometry ratio of p-CaMKIIa blots to CaMKIIa were labeled below the blots (b) si-CaMKIIα (50-nM per well) was transfected into CCF-STTG1 cells in a 6-well plate using LipofectamineTM 3000. After transfection for 43–46 h, the cells were inoculated with RPMI or ZIKV (MOI = 3). Subsequently, the cells were harvested 6 h or 24 h post-infection for western blot. Densitometry from p-CaMKIIa and CCN1 blots normalized for beta-actin were labeled below the blots.The relative level of ZKIV E and CCN1 protein of three experiments were quantized and summarized in the bar graph on the right(c, d) HA-CaMKIIα (0–1.5-μg) per well was transfected into CCF-STTG1 cells in a 6-well plate using LipofectamineTM 3000. After transfection for 8–10 h, the cells were inoculated with ZIKV (MOI = 3) (c) or mock infected with RPMI-1640 (d) . Subsequently, the cells were harvested 6 h or 36 h post-infection for western blot. The relative level of p-CREB, CCN1 and ZKIV E protein of three experiments were quantized and summarized in the bar graphs below.The blots were visualized and analyzed using the Bio-Rad imaging system. Statistical analyses were performed using GraphPad Prism 6.0 software. Data are expressed as the mean ± standard deviation (SD) (*, P < 0.05; **, P < 0.01; ***, P < 0.001)
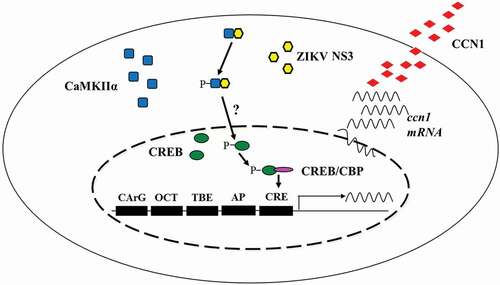
Figure 9. Schematic diagram of the mechanism by which ZIKV regulates CCN1 expression in astrocytes. We found that NS3 specifically interacted with the regulatory domain of CaMKIIα and enhanced CaMKIIα phosphorylation at the Thr286 site. Activated CaMKIIα enhanced CREB Ser133 phosphorylation activity in the cell nucleus, which increased its association with CBP or other transcription coactivators, thereby promoting the expression of CCN1 genes containing CRE. However, it is unclear whether CaMKIIα directly or indirectly regulates CREB phosphorylation