
Figures & data
Figure 1. Study outline
Figure 2. Uptake, CFUs and global transcriptome profile of hMDMs infected with mycobacteria. (a) Percent uptake of M. smegmatis, M. bovis BCG and M. tb R179 by hMDMs at 4 h, the percent uptake was calculated by dividing the number of bacteria taken up per milliliter by number of macrophages in each well., (b) CFUs of mycobacteria with multiplicity of infection (MOI) of 1 at 12- and 24-h post infection, and (c) heatmap of differentially expressed transcripts analyzed by AmpliSeq where hMDMs infected with M. smegmatis, M. bovis BCG or M. tb R179 were compared to uninfected hMDMs. The level of expression of each gene in each sample in comparison to the level of expression of uninfected sample is depicted with a color scale with red as maximum and blue as the minimum expression. M. smegmatis having the maximum red indicates stronger host response as compared to other two strains. Dendrogram indicates sample clustering
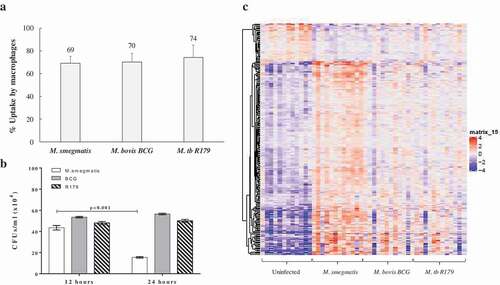
Table 1. Demographic characteristics of study participants
Figure 3. Differential expression of host gene transcripts in infected hMDMs. Heatmap of 19 differentially expressed transcripts with lowest false-discovery-rate analyzed by Ampliseq, hMDMs infected with M. smegmatis, M. bovis BCG or M. tb R179 were compared to uninfected hMDMs. The level of expression of each gene in each sample in comparison to the level of expression of uninfected sample is depicted with a color scale with red as minimum and white as the maximum expression. Dendrogram indicates sample clustering
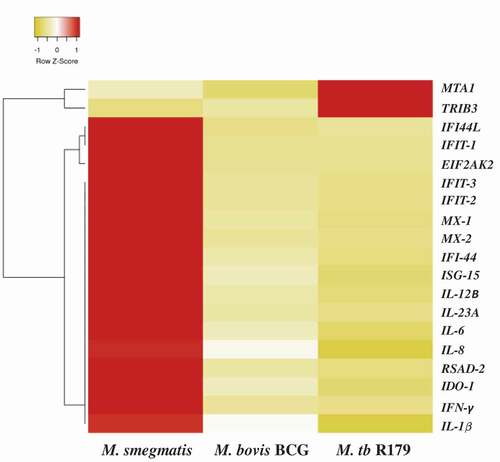
Table 2. Differentially expressed genes selected from AmpliSeq analysis of hMDMs 12-h post infection with pathogenic (M. bovis BCG, M. tb R179) and nonpathogenic (M. smegmatis) mycobacteria
Table 4. Top upstream regulators activated in hMDMs after infection with mycobacteria with respect to 19 potential DEGs
Figure 4. Cytokines levels after infection of hMDMs with M. smegmatis, M. bovis BCG or M. tb R179 compared to uninfected hMDMs measured through multiplex ELISA. (a) INF-γ, (b) IL-1β, (c) IL-12p40, (d) IL-12p70, (e) IL-6, and (f) IL-23. Detailed comparison of multiplex ELISA results are in Table S1
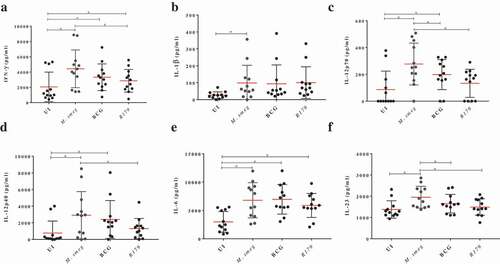
Figure 5. Expression analysis using qRT-PCR of twelve key transcriptomes (a) and seven key cytokines (b) in hMDMs of 12 healthy participants infected with M. smegmatis, M. bovis BCG or M. tb R179 as compared to uninfected hMDMs. (*) depicts significant (p < 0.05) expression
Table 3. Top canonical pathways activated in hMDMs after infection with mycobacteria with respect to 19 potential DEGs
Table 5. Top regulator effect networks in hMDMs after infection with mycobacteria with respect to 19 potential DEGs
Supplemental Material
Download MS Word (361.6 KB)Data Availability Statement
AmpliSeqTM data have been deposited in the NCBI Gene Expression Omnibus (GEO) database with experiment series accession number [GSE122619]. https://www.ncbi.nlm.nih.gov/geo/query/acc.cgi?acc=GSE122619