Figures & data
Table 1. Bacterial strains and plasmids
Figure 1. Bacterial Adhesion on colon cancer epithelial cells HCT116. (a) Adhesion assay with WT, ΔSEN1008 and ΔSEN1008/pCH112-1008 in HCT116 showing the restoration of WT phenotype in the complemented strain. (b) Fluorescence microscopy to show adhesion of GFP-expressing WT and ΔSEN1008 on HCT116 with a MOI of 20 bacteria/cell. Salmonella shown in green. Scale 100 µm. (c) Expression of genes encoding Type I fimbriae in WTvsΔSEN1008throughqRT-PCR. The data were presented corresponding to the fold-change differences in gene expression in ΔSEN1008with respect to WT. Results were deduced from three independent experiments in triplicates and data represented as mean ± SD. ns, not significant (P > 0.05); Statistical significance: *P < 0.05, **P < 0.01, ***P < 0.001 (Student’s t-test)
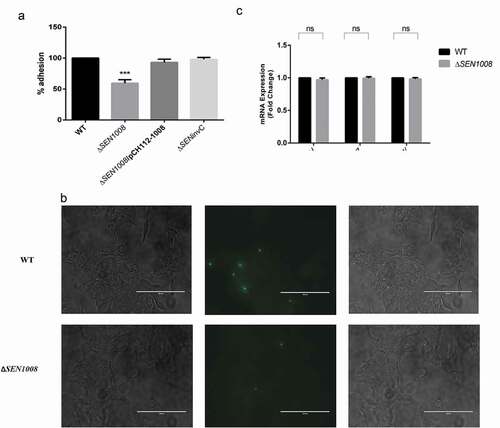
Figure 2. Bacterial uptake assay in murine macrophages RAW264.7 and analysis of motility. (a) Uptake of WT, ΔSEN1008 and ΔSEN1008/pCH112-1008 by murine macrophages RAW264.7 at 2 h p.i. that shows restoration of WT phenotype in the complemented strain. (b) % uptake of GFP-expressing WT and ΔSEN1008 by RAW264.7 at a MOI of 10 bacteria/cell after 2 h of infection by flow cytometry. (c) Motility assay was performed with WT and ΔSEN1008 by placing 1 µl log-phase cultures of bacteria with same O.D on 0.3% LB agar plates. After 5 h of growth, the diameter of the growth region was measured. Scale in cm. (d) Bar diagram for % motility of Salmonellameasured from diameters of the bacterial growth. (e) Expression of genes related to flagellarassemblyinWTvsΔSEN1008throughqRT-PCR. Results were deduced from three independent experiments in triplicates and data represented as mean ± SD. ns, not significant (P > 0.05); Statistical significance: *P < 0.05, **P < 0.01, ***P < 0.001 (Student’s t-test)
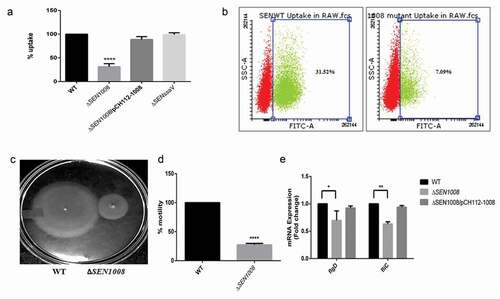
Figure 3. Bacterial intracellular replication assay in RAW264.7 murine macrophages and ATR assay. (a) Survival Assay of WT, ΔSEN1008 and ΔSEN1008/pCH112-1008in RAW264.7 murine macrophages at 24 h time-point. (b) % survival of GFP-expressing WT and ΔSEN1008 by RAW264.7 at a MOI of 10 bacteria/cell after 24 h of infection by flow cytometry. (c) The log-phase ATR of S. Enteritidis WT. (d) ATR assay of WT, ΔSEN1008 and ΔSEN1008/pCH112-1008. (e)qRT-PCR analysis of SEN1008 under normal (pH 7.6), adaptation (pH 4.4) and challenge (pH 3.1, 1 h) respectively. Results were deduced from three independent experiments in triplicates and data represented as mean ± SD. ns, not significant (P > 0.05); Statistical significance: *P < 0.05, **P < 0.01, ***P < 0.001 (Student’s t-test)
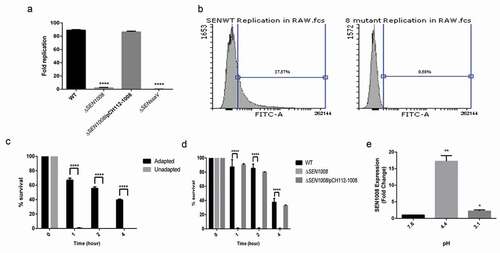
Figure 4. In vivo characterization of ΔSEN1008. Different groups of streptomycin-pretreated C57BL/6 mice were orally fed with ~107cfu of WT, ΔSEN1008, ΔSEN1008/pCH112-1008 and PBS (negative control) separately. (a) Bacterial dissemination: At day 3 p.i., mice were euthanized and the bacterial load was enumerated in mLN, spleen, liver and cecum by plating on MacConkey agar. (b-d) Tissue histopathology: Hematoxylin-Eosin stained images for sections of mice cecal tissue (5 µm size) from WT, ΔSEN1008 and ΔSEN1008/pCH112-1008 infected mice (left to right). Scale bar 100 µm. S, submucosal edema; Lp, lamina propria; L, lumen. (e) Determination of cecalpathoscore based on the parameters described in materials and methods.. (f) Assessment of competitive colonization by WITS- tagged WT (WITS2), ΔSEN1008(WITS11) and ΔSEN1008/pCH112-1008 (WITS21). Mice were infected with equal proportions of each strain with a total inoculum pool of ~107cfu. At 72 h p.i., the mice were sacrificed and their mLN, spleen, liver, and cecum were collected and homogenized. The genomic DNA was isolated from each organ and the bacterial load of each strain was enumerated by qRT-PCR using WITS specific primers. The data were expressed as the ratio of WITS with respect to WITS21. Number of mice (n) = 5 for each group. Statistical significance: *P < 0.05, **P < 0.01, ***P < 0.001, ****P < 0.0001 (Student’s t-tests for Fig. 4A and 4E and Two-way ANOVA for Fig 4 F)
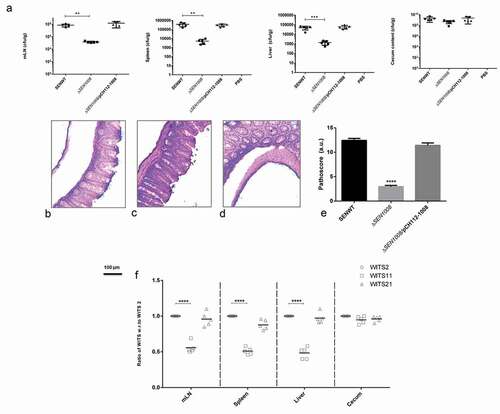
Figure 5. SPI-2 genes expression of WT vs. ΔSEN1008 from infected mice tissues through qRT-PCR analysis. (a) Expression of SPI-2 genes in mLN; WT vs. ΔSEN1008.(b) Expression of SPI-2 genes in spleen; WT vs. ΔSEN1008. qRT-PCR was performed thrice in triplicate from each mice group (n = 5). Statistical significance: *P < 0.05, **P < 0.01, ***P < 0.001, ****P < 0.0001 (One way ANOVA)
Figure 6. In vivo evaluation of pro- and anti–inflammatory cytokines from infected mice serum. (a) 50 µg of serum samples from indicated mice group were collected 72 h p.i. and run on 12% SDS PAGE; followed by transfer onto PVDF membrane, developed by western blot using appropriate primary (1:2000) and secondary (1:3000) antibodies in dark. (b) Quantification of the blots using ImageJ software. Statistical significance: *P < 0.05, **P < 0.01, ***P < 0.001, ****P < 0.0001 (Student’s t-test)