Figures & data
Table 1. Bacterial strains and plasmids used in this work
Figure 1. Representative image of the surface-associated motility of the indicated A. baumannii strains
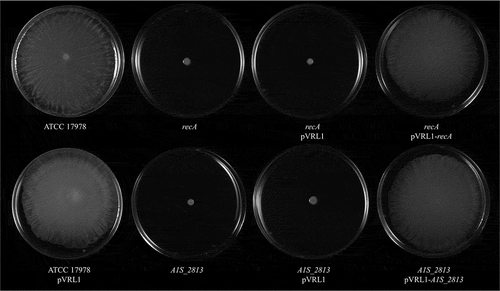
Figure 2. The fold-change between viable bacteria (CFU) of the indicated strains, calculated as the number of CFU in capillaries containing chemoattractant (2% methanol) divided by the number in control capillaries containing only CB (chemotaxis buffer). Error bars represent the standard deviation (SD) of the means. *P < 0.05 in a comparison with the A. baumannii parental strain (ATCC 17978) and based on at least nine independent experiments
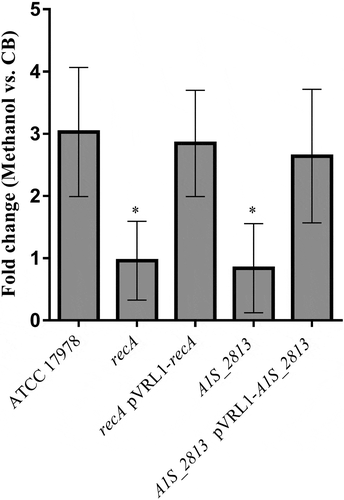
Figure 3. Transmission electron microscopy of the indicated A. baumannii strains. The images were obtained at 4,000 × magnification
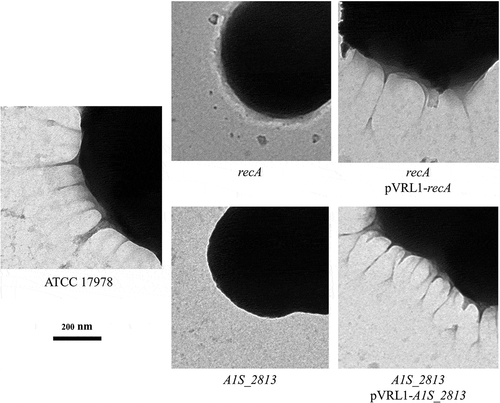
Figure 4. (a) Representative results of a C. elegans fertility assay using the indicated strains of A. baumannii. *P < 0.05 compared to the parental ATCC 17978 strain. E. coli strain OP50 was included as a low virulent control. (b) Representative G. mellonella killing assay of the specified strains. Larvae (n = 10 per group) were inoculated with either ~106 CFU of the indicated strain or PBS (as a negative control). Error bars represent the SDs of the means. *P < 0.05 in a comparison with the A. baumannii parental strain (ATCC 17978)
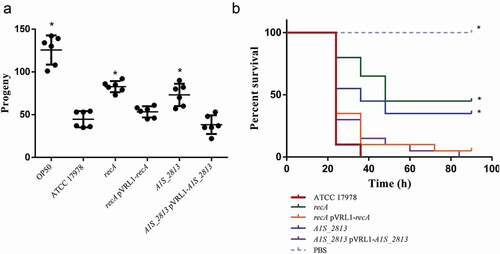
Figure 5. (a) Predicted secondary structure of the S. enterica CheW and A. baumannii CheW-like proteins. The green boxes indicate the S. enterica CheW domains involved in the interaction with RecA. (b) Results of a co-immunoprecipitation assay between the A. baumannii RecA-FLAG and A1S_2813-6× His proteins. The supernatants were separated by SDS-PAGE and assessed by western blotting. The image is representative of three independent experiments using three different lysates for each protein. The presence (+) or absence (−) of the RecA-FLAG or A1S_2813-6× His proteins in the corresponding lysate mixture is indicated, as is that of the antibody-coated beads used in each mixture. The RecA-FLAG and A1S_2813-6× His bands detected on a western blot are shown. M: molecular mass marker
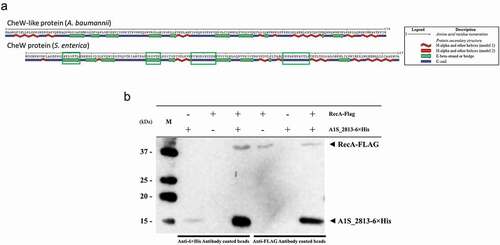
Figure 6. (a) Detail of a selected conserved region in the predicted secondary structure of the S. enterica CheW and A. baumannii CheW-like proteins. The large and small green boxes indicate, respectively, a known domain and a residue of S. enterica CheW protein involved in the interaction with RecA. The black circles indicate the subsequently mutagenized residues from the A. baumannii CheW-like protein. (b) Co-immunoprecipitation of the RecA-FLAG and A1S_2813-6× His proteins and the derivative A1S_2813-6× His site-specific mutagenized proteins. The supernatants were separated by SDS-PAGE and assessed by western blotting. The images are representative of those from three independent assays. The presence of the RecA-FLAG and A1S_2813-6× His proteins (WT) and the absence of (-) or residue change (Ser97Ala or Ile121Ala) in A1S_2813-6× His in the corresponding mixtures are indicated. The western blot shows the RecA-FLAG and A1S_2813-6× His protein bands revealed following incubation of the lysates with anti-FLAG coated beads. M: molecular mass marker
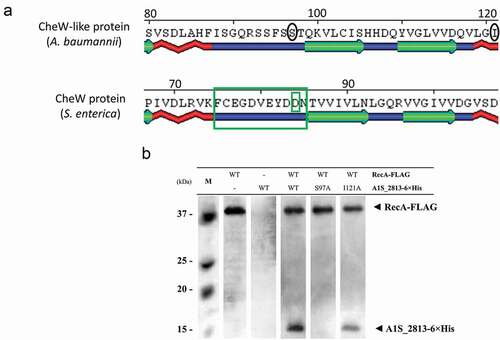
Figure 7. (a) Representative image of the surface-associated motility of the indicated A. baumannii strains. (b) The fold-change in the number of viable bacteria (CFU) of the indicated strains, based on the counts in capillaries containing chemoattractant (2% methanol) divided by those in control capillaries containing only CB. Error bars represent the SDs of the means. *P < 0.05 in a comparison with the A. baumannii parental strain (ATCC 17978) as determined in at least nine independent experiments
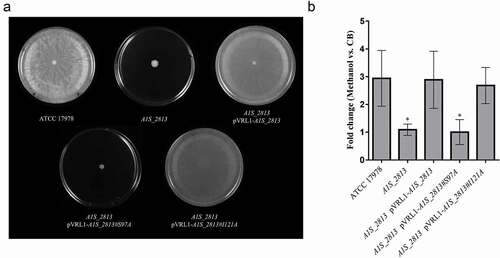
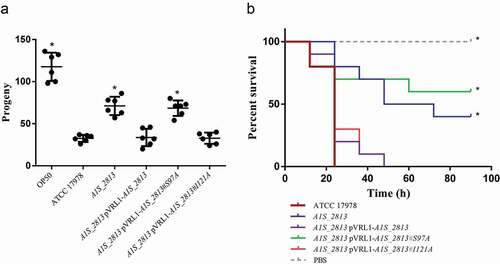
Figure 8. (a) Representative results of a C. elegans fertility assay with the indicated strains. *P < 0.05 in a comparison with the A. baumannii parental strain (ATCC 17,978). E. coli strain OP50 was included as a low virulent control. (b) Representative results of a G. mellonella killing assay of the specified strains. Larvae (n = 10 per group) were inoculated with ~106 CFU of the indicated strain or PBS (as a negative control). Error bars represent the SDs of the means. *P < 0.05 in a comparison with the A. baumannii parental strain (ATCC 17978)