Figures & data
Table 1. Essential genes required for growth of S. suis in pigs.
Figure 1. Bacterial loads in (a) blood and (b) CSF after intravenous and intrathecal infection of pigs with S. suis strain 10 and (c) histological changes in central nervous tissues. Bacterial loads were calculated by CFU determination each hour post infection (hpi). Each symbol and line represent one individual animal of four. Histological examinations show typical suppurative meningitis (arrows) in various degrees in the spinal cord (left panel), cerebellum (central panel), and cerebrum (right panel) of inoculated pigs. Star symbol indicates the location of nervous tissue.
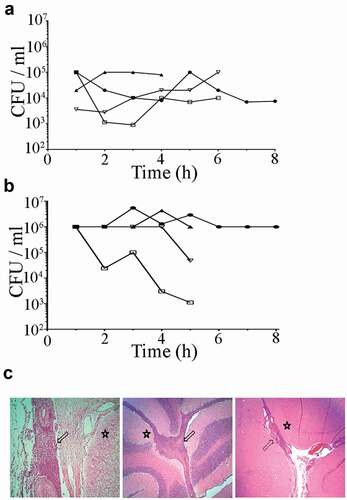
Figure 2. Global overview of Tn-Seq screen. (a) Hierarchical clustering of the complete gene set obtained for each infection site. The level of essentiality for each gene is color-coded as indicated. Genes with an increased log2 fold change lower than 2 were considered essential in vivo, higher than 2 were considered as beneficial; otherwise, they were considered as no required. (b) VENN diagram indicating the number of unique or shared essential genes within infection sites. (c) Categorization of gene ontologies of the essential gene set for blood, brain, and CSF according to genome annotations.
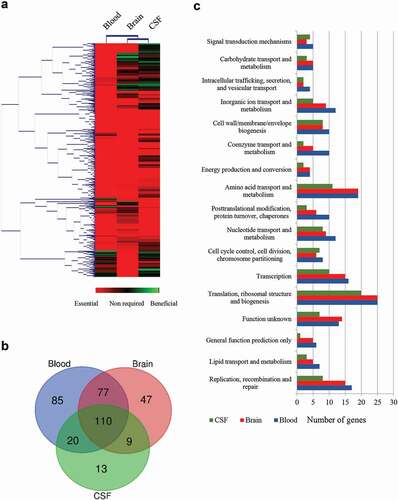
Figure 3. Survival of S. suis strain 10 and derivative mutants in ex vivo (a) porcine blood, (b) porcine serum, and (c) porcine CSF. Bacteria were cultured in THB medium, diluted, and then incubated in the different body fluids. The number of bacteria was determined by CFU counting at time 0 and every 2 h over a time course of 6 h. Data are expressed as the total area under the curve obtained in three independent experiments and relative to that of the wild type (left) representative growth curves for selected strains are shown (right). One or two asterisks indicate statistically significant differences compared to the wild type at P < 0.05 and P < 0.001, respectively.
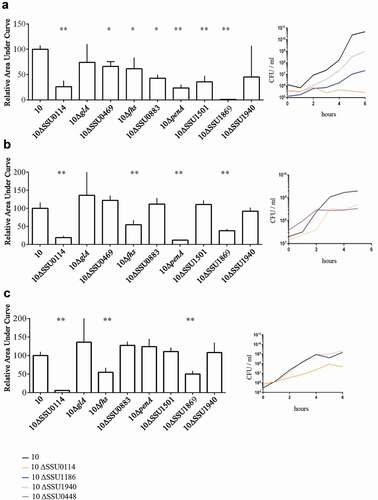
Figure 4. Growth curve of S. suis strain 10 and mutant derivatives under different environmental conditions. Bacteria were cultured in THB medium (a, d, e, f) at 37̊C, (b) at 42̊C and (c) at 34̊C in presence of (d) 5 mM NaF, (e) 2 mM H2O2 and (f) 1 mM of Bipyridyl, and the optical density at 600 nm (OD600) was measured every 20 minutes over a time course of 18 hours.
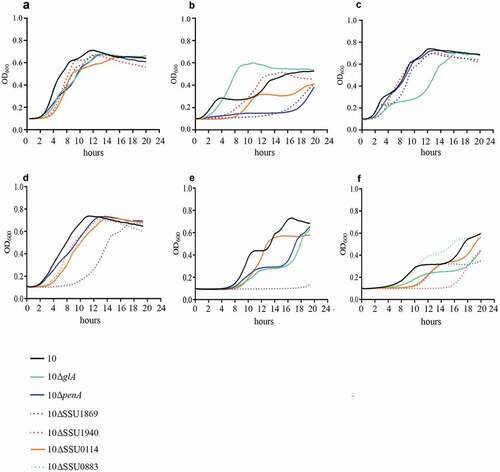
Figure 5. Bacterial load in blood and organs after intravenous infection of pigs with strain 10 and mutant derivatives (a) 10∆penA, (b) 10∆SSU1869, and (c) 10∆SSU1940. Cells of strain 10 and mutant derivatives carrying a spectinomycin-resistance marker, were mixed 1:1 and the resulting suspensions were used to infect animals. Bacterial loads of the wildtype and mutants in blood, one- and two-day post-infection (dpi), in internal organs and brain, four dpi, were determined by plating on solid media containing or not spectinomycin and counting colony-forming units after overnight incubation. The ratio wild type/mutant is shown and the number of animals that resulted positive for each strain is depicted at the top. The ratio wildtype/mutant in blood remained similar to the three dpi.