Figures & data
Figure 1. EV71 3D protein interacts with ACOX1. (a) HEK293 T cells were co-transfected with pFlag-ACOX1 expressing Flag-tagged ACOX1 protein and pHA-3D expressing HA-tagged EV71 3D protein. Cell lysates were subjected to immunoprecipitation (IP) with control IgG and anti-Flag antibody (upper panel) or control IgG and anti-HA antibody (lower panel). The immune-precipitates and whole-cell lysates (WCLs) (input) were analyzed by Western blotting with the indicated antibodies. IB, immunoblotting. (b) RD cells were infected with EV71 at an MOI of 2 for 10 hours. Cell lysates were subjected to immunoprecipitation (IP) with control IgG and anti-ACOX1 antibody. The immune-precipitates and whole-cell lysates (WCLs) (input) were analyzed by Western blotting with the indicated antibodies. IB, immunoblotting. (c) HEK293 T cells were co-transfected with plasmid expressing HA-3D and plasmids Flag-ACOX1, Flag-ACOX1-N, or Flag-ACOX1-C expressing Flag-tagged ACOX1, N- or C-terminal ACOX1 components. Cell lysates were immunoprecipitated with IgG or anti-Flag. The immunoprecipitates and lysate were analyzed by Western blotting with the indicated antibodies. IB, immunoblotting. (d) HEK293 T cells were co-transfected with plasmids expressing Flag-ACOX1, Myc-ACOX1 and vector or HA-3D. Cell lysates were immunoprecipitated with IgG or anti-Flag. The immunoprecipitates and lysate were analyzed by Western blotting. (e) U251 cells were transfected with plasmid expressing HA-3D and plasmid expressing Flag-ACOX1. Cells were immunostained with anti-HA and anti-Flag antibodies, and the nucleus was stained with DAPI, cells were analyzed by confocal microscopy
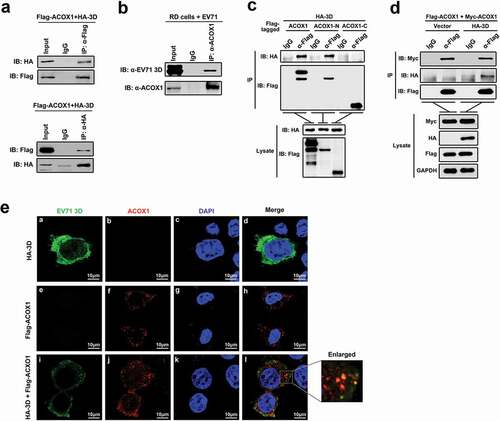
Figure 2. EV71 attenuates ACOX1 protein expression through 3D. (a–d) RD cells were infected with EV71 at an MOI of 2 for different times (a) and (c) or at different MOIs for 12 h (b) and (d). The ACOX1 mRNA (A and B, top panels) and EV71 VP1 mRNA ((a) and (b), bottom panels) were measured by qRT-PCR and normalized to GAPDH mRNA. The ACOX1 and EV71 VP1 proteins in WCLs were determined by Western blot, GAPDH was used as loading control (c) and (d). (e) SK-N-SH cells were infected with EV71 at different MOIs for 48 h. (f) U251 cells were infected with EV71 at different MOIs for 24 h. (g) SK-N-SH cells were infected with EV71 at an MOI of 2 for different times, the viability of cells was measured by CCK8 assay. (h) RD cells were transfected with pFlag-ACOX1 for 24 h, and then infected with EV71 at different MOIs for 12 h. (i) RD cells were transfected with vector or pHA-3D at different concentrations for 36 h. (j) Control U251 cells and stable U251 cells expressing EV71 3D were treated with DMSO, CQ (10 μM), or MG132 (20 μM) for 10 h. (k) HEK293 T cells were co-transfected with pFlag-ACOX1 along with pHA-3D. Cells were treated with or without MG132 (20 μM) for 10 hours before harvest. (l) Control U251 cells and stable U251 cells expressing EV71 3D were analyzed by Western blot
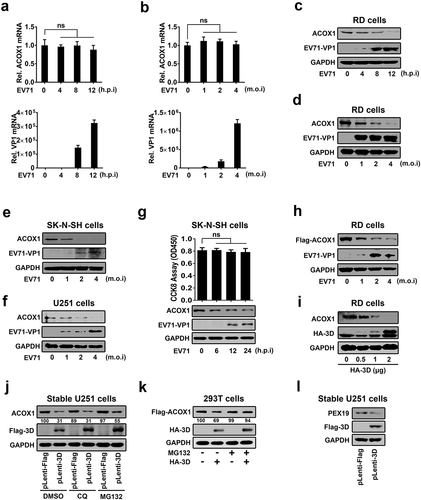
Figure 3. EV71 infection and ACOX1 knockdown reduce peroxisome numbers. (a) Expression of ACOX1 protein in stable U251 cell line was determined by Western blot. (b) Stable shACOX1 U251 cells and control cells were subjected to immunofluorescence microscopy analysis using antibody against PMP70. (c) The numbers of peroxisomes per cell in stable shACOX1 U251 cells (18 cells counted) and control cells (23 cells counted) were analyzed using ImageJ software. (d-g) RD cells (d) and (e) and U251 cells (f) and (g) were mock infected or infected with EV71, cells were immune-stained with anti-PMP70 and anti-EV71 VP1 antibodies (d) and (f). The numbers of peroxisomes per cell in mock infected (11 cells counted) or EV71 infected (10 cells counted) RD cells (e), and in mock infected (14 cells counted) or EV71 infected (11 cells counted) U251 cells (g) were analyzed using ImageJ software
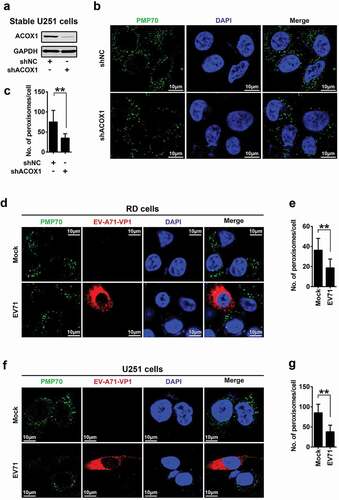
Figure 4. EV71 infection down-regulates expression of peroxisomal proteins. (a) and (b) RD cells (a) and U251 cells (b) were infected with EV71 at the indicated MOIs for 12 hours (A) and 24 hours (B), protein levels were determined by Western blot. (c) and (d) RD cells were infected with EV71 at a MOI of 2 for different times (c) or at different MOIs for 12 h (d). (e) U251 cells were infected with EV71 at different MOIs for 24 h. The mRNA levels of catalase, PEX19, and EV71 VP1 were measured by qRT-PCR and normalized to GAPDH mRNA

Figure 5. ACOX1 knockdown and peroxisome disruption promotes apoptosis and autophagy in neural cells. (a–c) SK-N-SH cells were transfected with negative control shRNA (shNC) or shACOX1 for 72 h (a). U251 cells were transfected with shNC or shACOX1 for 60 h (b). RD cells were transfected with negative control shRNA (shNC) or shACOX1 for 72 h (c). The viability of cells was measured by CCK8 assay. The expression of ACOX1 protein was determined by Western blot. (d) SK-N-SH cells were transfected with shNC or sh-ACOX1 at different times. LDH activity in cell culture supernatants was tested. The expression of ACOX1 protein was determined by Western blot. (e) The viability of control SK-N-SH cells and stable SK-N-SH cells expressing EV71 3D was measured by CCK8 assay. (f) The viability of control U251 cells and stable U251 cells expressing EV71 3D was measured by CCK8 assay. (g) The viability of RD cells transfected with or without pHA-3D was measured by CCK8 assay. (h) The viability of control SK-N-SH cells and stable SK-N-SH cells expressing EV71 3D was measured by LDH assay. (i–k) SK-N-SH cells (i), U251 cells (j), and RD cells (k) were transfected with shNC or shACOX1 for 72 h. Protein levels in treated cells were determined by Western blot analyses using the corresponding antibodies as indicated. (l) U251 cells were transfected with negative control siRNA (siNC) or siPEX19 for 36 h. Cell lysates were analyzed by Western blot
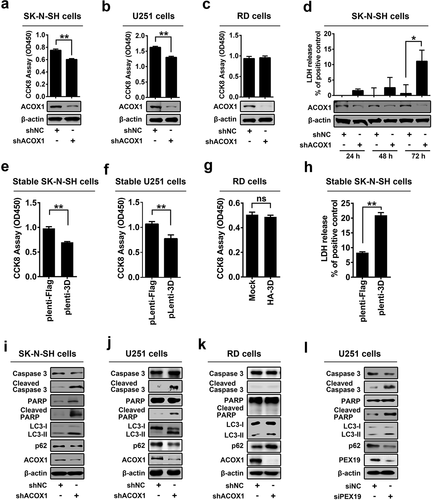
Figure 6. EV71 induces neural cell death through attenuating ACOX1 production. (a) and (b) Expression of ACOX1 protein in ACOX1 knockdown stable RD cells (a) and stable SK-N-SH cells (b) were determined by Western blot. (c-f) shNC or shACOX1 stable SK-N-SH cells were mock-infected or infected with EV71 (MOI = 5). Cell viability was analyzed by CCK8 assay at 72 h after infection ((c), left panel), and cell death induced by EV71 infection was calculated as percentage of the CCK8 value reduction of shNC or shACOX1 stable cells infected by EV71 ((c), right panel). LDH activity in cell culture supernatants was measured at 48 h post-infection, expression of EV71 VP1 and ACOX1 were determined by Western blot ((d), left panel), and cell death induced by EV71 infection was calculated as percentage of LDH release from shNC or shACOX1 stable cells infected by EV71 ((d), right panel). Cell apoptosis was analyzed by annexin V-FITC and propidium iodide (PI) staining and flow cytometry at 36 h post-infection (e) and (f). Percentage of apoptotic cells in three independent experiments were calculated (f). (g) Control U251 cells and stable U251 cells expressing EV71 3D were transfected with vector or plasmid expressing Myc-ACOX1; 48 hours later, expression of proteins was determined by Western blot as indicated. (h) shNC or shACOX1 stable RD cells were mock infected or infected with EV71 (MOI = 0.5). Photographs were taken at 24 or 48 h post-infection. (i–l) shNC or shACOX1 stable RD cells were mock infected or infected with EV71 (MOI = 0.25). Cell viability was analyzed by CCK8 assay at 24 h post-infection, expression of EV71 VP1 and ACOX1 were determined by Western blot ((i), left panel), and cell death induced by EV71 infection was calculated as percentage of the CCK8 value reduction of shNC or shACOX1 stable cells infected by EV71 ((i), right panel). LDH activity in cell culture supernatants was measured (j). Cell apoptosis was analyzed by annexin V-FITC and propidium iodide (PI) staining and flow cytometry at 12 h post-infection (k) and (l). Percentage of apoptotic cells in three independent experiments was calculated (l)
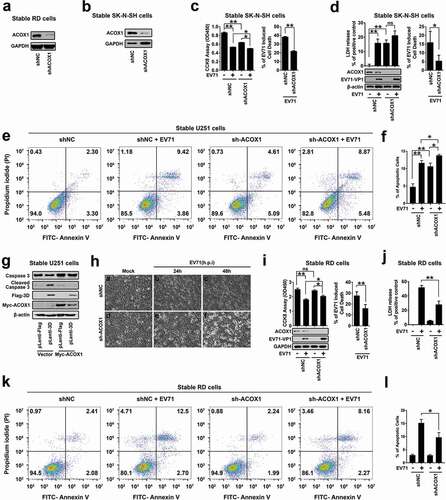
Figure 7. EV71 infection and ACOX1 knockdown promote neural cell death through inducing ROS and attenuating the DJ-1/NRF2/HO-1 pathway. (a) RD cells were infected with EV71 at the indicated MOIs for 18 h. SK-N-SH cells were infected with EV71 at the indicated MOIs for 48 h. U251 cells were infected with EV71 at the indicated MOIs for 24 h. Cellular ROS level was tested using a ROS detection kit. (b) Cellular ROS levels in stable ACOX1 knockdown RD cells, stable ACOX1 knockdown SK-N-SH cells, and stable ACOX1 knockdown U251 cells were tested. (c) RD cells were infected with EV71 at different MOIs for 12 h. U251 cells were infected with EV71 at an MOI of 2 for different times. (d) Stable ACOX1 knockdown cells were subjected to Western blot analysis. (e) RD cells were infected with EV71 at an MOI of 2 for different times. SK-N-SH cells were infected with EV71 at an MOI of 2 for different times. U251 cells were infected with EV71 at an MOI of 2 for different times. (f) Stable EV71 3D expressing cells were subjected to Western blot analysis. (g) Stable ACOX1 knockdown cells were subjected to Western blot analysis. (h) RD cells, and U251 cells were transfected with vector or plasmid expressing EV71 3D protein, 48 hours after transfection, the mRNA levels of NRF2, and DJ-1 were measured by qRT-PCR and normalized to GAPDH mRNA
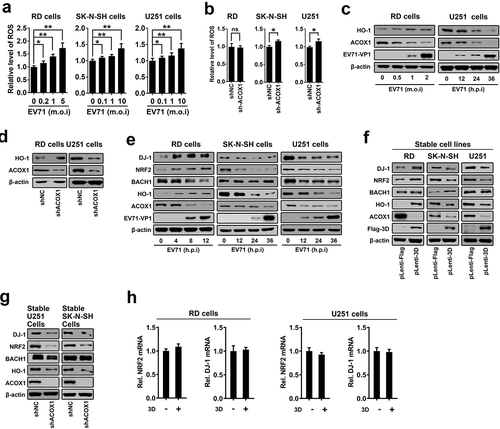
Figure 8. EV71 infection-induced cell death can be rescued by antioxidants treatment. (a) and (b): SK-N-SH cells (a) and U251 cells (b) were transfected with or without pHA-HO-1, 24 hours after transfection, cells were infected with EV71 at an MOI of 2 for 24 h. (c) and (d) RD cells (c) or U251 cells (d) were infected with EV71 at an MOI of 0.25 or at an MOI of 2, respectively, for 24 h. LA (1 mM) or NAC (0.4 mM) were added into cell culture supernatant at 2 h post-infection. (a-d) Treated cells were analyzed using CCK-8 assay kit and Western blot ((a-d), left panels), percentages of EV71 infection-induced cell death with or without HO-1 transfection or antioxidants treatment were calculated ((a-d), right panels)
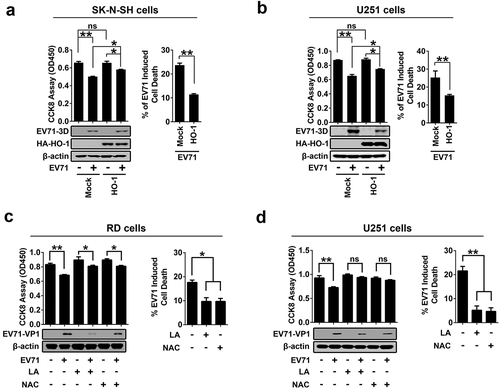
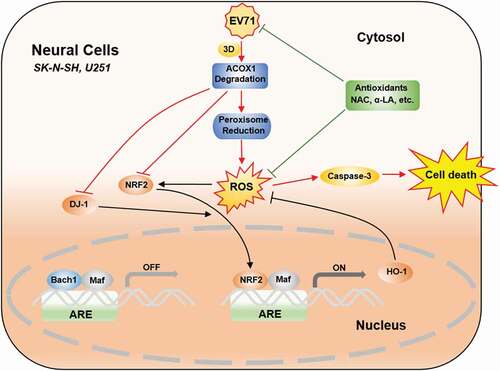
Figure 9. EV71 induces neural cell apoptosis and autophagy through promoting ACOX1 downregulation and ROS accumulation. In normal conditions, antioxidant response elements (AREs) are bound by small Maf dimers or other repressive factors like Bach1. Reactive oxidative stress (ROS) causes the nuclear translocation of NRF2. The activation of NRF2 is further promoted by positive pathway modulators like DJ-1. As a result, antioxidant response genes, like HO-1, are transcriptionally induced, and oxidative damage is minimized. In neural cells, including SK-N-SH cells and U251 cells, EV71 infection results in ACOX1 downregulation through 3D protein, further leads to peroxisome reduction. ACOX1 and peroxisome reduction increase ROS generation. ACOX1 knockdown downregulates DJ-1, NRF2, and HO-1 expression. ROS generation increase and antioxidant response downregulation together result in ROS accumulation, which further leads to caspase-3 activation and cell death. Treatment of antioxidants, including NAC and α-LA, inhibits EV71 replication, scavenges ROS production, and protects neural cells from death