Figures & data
Table 1. Strains included in this study.
Table 2. Oligonucleotides used in this study.
Figure 1. PepO expression in S. mutans strains. (a) Box plot comparisons of relative levels of pepO transcripts in serotype c/e strains with reduced C3b-binding isolated from the bloodstream (SA13, SA15, SA16, SA18) and oral stains with significant binding to C3b (UA159, 3SN1, 8ID3, 11SSST2, 15VF2). Levels of pepO transcripts were normalized by the respective levels of 16 S rRNA gene transcripts, as determined by RT-qPCR in samples with equivalent numbers of bacterial cells at A550 nm 0.3. (b) Western blot analysis of PepO production. Protein extracts (10 µg) obtained from each strain (at A550 nm 0.3) were resolved in 10% SDS-PAGE gels, which were either transferred to PVDF membranes to probe PepO with anti-rPepO antibodies (upper panel) or stained with Coomassie blue (lower panel) to monitor protein integrity. Images are representative of three independent experiments. (c) Comparisons of densitometric arbitrary units (au) of PepO detected in the Western blot analysis. Values represent mean densitometric measures of PepO obtained in three independent cultures. Asterisks indicate significant differences between groups (Mann–Whitney U-test; p < 0.05). (d) Western blot analysis of PepO in culture supernatants and cell factions in representative strains (SA13 and 15VF2). Western blot assays (upper panels) were performed with equivalent amounts of protein (10 µg) from culture supernatants or from bacterial cells, which were collected from CDM cultures (A550 nm 1.0). Protein integrity was monitored in Coomassie blue stained SDS-PAGE gels (lower panel).
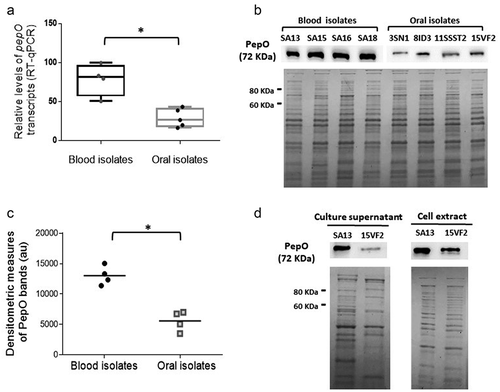
Figure 2. Regulation of pepO by the TCS VicRK and CovR orphan regulator in S. mutans strains. (a,c) Comparisons of pepO transcript levels between covR (UAcov and OMZcov) or vicK (UAvic and OMZvic) isogenic mutants with the respective parent strains (UA159 and OMZ175). Transcript levels were determined by RT-qPCR with specific primers in cells at A550 nm 0.3. PepO transcript levels were normalized by 16 S rRNA gene transcripts. (b,d) Comparisons of the amounts of PepO produced by mutant, parent, and complemented (+) strains. Relative amounts of PepO were determined in proteins extracts (10 µg) obtained from cells at A550 nm 0.3 by densitometry of PepO bands probed with anti-rPepO antibodies in Western blot assays. Columns represent means of densitometric measures of blots obtained in three independent experiments (individual values represented by circles); bars indicate standard deviations. Representative blots are shown in lower panels. Asterisks indicate significant differences in relation to the respective parent strain (Kruskal–Wallis post hoc Dunn’s test; p < 0.05). (e,f) Comparisons of transcriptional activities of vicR and vicK (encoding for the VicRK TCS) between blood and oral isolates. Transcript levels of vicR and vicK were determined by RT-qPCR with specific primers and normalized by 16 S rRNA gene transcripts in cells at A550 nm 0.3. Asterisks indicate significant differences between groups (Mann–Whitney U-test; p < 0.05).
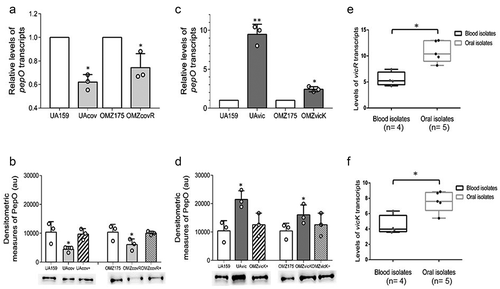
Figure 3. EMSA analysis of rCovR and rVicR binding to the promoter region of pepO. Specificity of binding was confirmed in competitive assays with excess of unlabeled test pepO DNA fragment (cold+) and excess of unlabeled negative control DNA fragments (gtfD and covR fragments for rCovR and rVicR binding, respectively; cold-). Image is representative of three independent experiments.
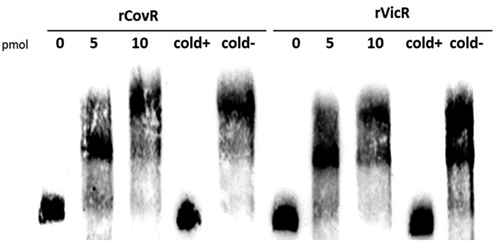
Figure 4. Effects of pepO and/or cnm inactivation on S. mutans interactions with complement proteins. Isogenic pepO (UApepO and OMZpepO) and cnm (OMZcnm) single mutants, as well as the OMZ175 double mutant (OMZcnm/pepO) were compared to the respective parent (UA159 or OMZ175) and complemented (+) strains. Strains were treated with 20% human serum and surface-bound C3b (a), C1q (b), or C4BP (c) probed with specific antibodies conjugated with FITC. Levels of surface-bound complement proteins were analyzed by flow cytometry and expressed as the geometric mean fluorescence intensity (MFI) of positive cells. Columns represent means of three independent experiments (individual values are represented with circles); bars represent standard deviations. Asterisks indicate significant differences in relation to the respective parent strain; hashtags indicate significant difference in relation to UA159 (Kruskal–Wallis with Dunn’s post hoc test; #, * p < 0.05; ** p < 0.01).
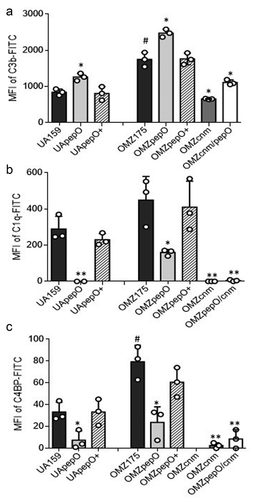
Figure 5. Binding of rPepO and rCnmA to human glycoproteins of the extracellular matrix, complement system, or plasma. Microtiter plates were coated with 5 µg/mL of each human glycoprotein and incubated with increasing amounts of rPepO (0–50 µg/mL) or rCnmA (0–2 µg/mL). BSA at 1% was used as control. Binding was detected using specific anti-PepO and anti-CnmA polyclonal antibodies. Data represent means of three independent experiments performed in triplicate. Bars indicate standard deviations. Asterisks indicate significant differences in relation to the respective control sample (ANOVA with post hoc Dunnett’s test; *p < 0.01).
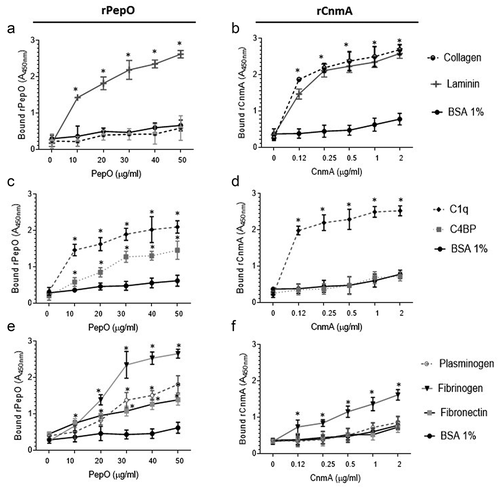
Figure 6. Ex vivo persistence in human blood and invasion to Human Coronary Artery Endothelial Cells (HCAEC) by S. mutans strains. (a,b) Equal numbers of bacterial cells were suspended into fresh human blood, and bacterial counts (log CFU/mL) determined at each time point of incubation (37°C). (a) Comparisons of cell counts of pepO mutant (UApepO), with parent (UA159) and complemented (+) strains. (B) Comparisons of cell counts of the single (OMZpepO and OMZcnm) or double (OMZcnm/pepO) mutants with parent (OMZ175) and complemented (+) strains. Data represent means of three independent experiments performed in triplicate. Bars indicate standard deviations. Asterisks indicate significant differences in relation to parent strain at each time point; symbols indicate significant differences between the double mutant OMZcnm/pepO and OMZpepO (#) or OMZcnm (†) (Kruskal–Wallis post hoc Dunn’s test using correction for repeated measures; p < 0.05). (C) Invasion of HCAEC by S. mutans strains. HCAEC were incubated with equal numbers of OMZ175, OMZcnm OMZpepO or OMZpepO+ complemented strain. After removal of extracellular bacteria by treatment with gentamicin and penicillin, S. mutans strains were recovered from intracellular compartment. The numbers of intracellular bacteria (CFU) were relative to parent strain OMZ175. Columns represent means of three independent experiments performed in duplicate (individual values are represented with circles). Bars represent standard deviations. Asterisks indicate significant differences in relation to OMZ175 (Mann–Whitney test; * p < 0.05; ** p < 0.01).
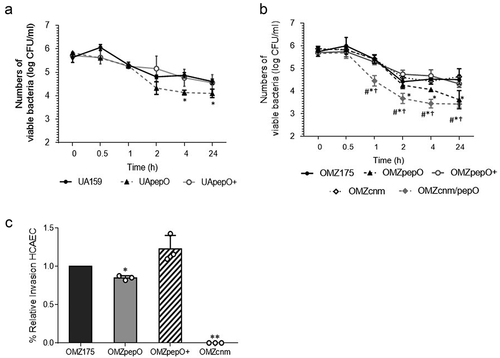
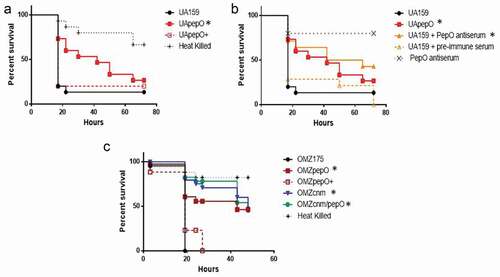
Figure 7. Killing of Galleria mellonella larvae infected with S. mutans strains. (a) Percents of larvae survival were compared between pepO mutant (UApepO) and the parent (UA159) or complemented (UApepO+) strains. (b) Percent survival of larvae, infected with UA159 treated or not with PepO antiserum to block PepO or with UApepO single mutant. UA159 treated with pre-immune serum was also used as control. (c) Comparisons of percent survival of larvae infected with single (OMZcnm or OMZpepO) or double mutant (OMZcnm/pepO) strains with parent (OMZ175) and complemented (OMZpepO+) strains. Heat killed bacteria and saline were used as negative controls in all the experiments. The results are representative of three independent experiments. Asterisks indicate significant differences in relation to parent strain (Kaplan–Meier curves compared using log rank test; *p < 0.01).