Figures & data
Figure 1. Schematic of comparisons made in this study: (a) three experiments investigating bat and fungal responses to growth in pathogenic and saprophytic contexts. Experimentally infected Myotis lucifugus (Experiment 1) and Eptesicus fuscus (Experiment 2) hibernated post-exposure under controlled conditions in captivity, and hibernating, wild Myotis myotis (Experiment 3) were sampled at the end of hibernation with natural exposure to Pseudogymnoascus destructans. (b) characterization of the response to bat white-nose syndrome (WNS) in a tolerant host, (c) comparison of the response of P. destructans to growth in a pathogenic context on three host species, based on data collected in (a), and (d) transillumination of the wings of bats exhibiting clinical signs of white-nose syndrome, allowing detection of fluorescing (lesion-positive) and non-fluorescing (lesion-negative) sites for paired-biopsy sampling.
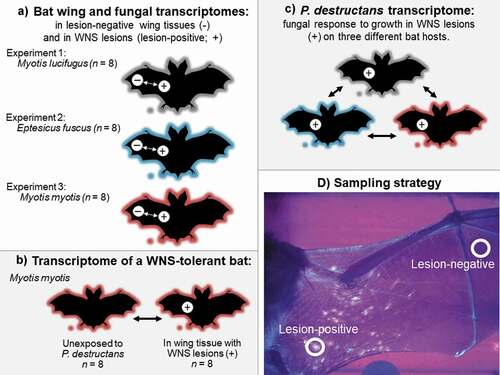
Figure 2. Proportion of paired-end reads from each sample that aligned to the Pseudogymnoascus destructans genome in paired lesion-negative (–) and lesion-positive (+) biopsy samples from the wings of bats exhibiting clinical signs of white-nose syndrome (n = 8 pairs of samples per species). Myotis lucifugus and Eptesicus fuscus were experimentally exposed to a Nearctic isolate of Pseudogymnoascus destructans prior to hibernation in captivity under controlled environmental conditions; free-ranging Myotis myotis were naturally exposed to a Palearctic strain of P. destructans during hibernation in a site in the Czech Republic. Proportion of reads per samples aligning to the P. destructans genome provide a proxy for the relative amounts of active P. destructans in each sample. Boxplots show median (mid-line) and mean (x).
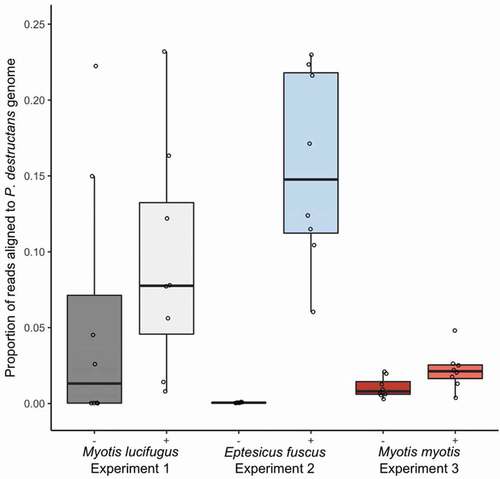
Figure 3. (a) Response of P. destructans to growth in WNS lesions on bat wings was most similar between Myotis lucifugus (gray) and Eptesicus fuscus (blue), and most different between M. myotis (red) and E. fuscus, but no GO-terms were enriched in the differentially expressed transcripts. Host response to the fungus varied greatly among bat species, shown by (b) low overlap among differentially expressed transcripts identified in each within-species comparison of lesion-negative and lesion-positive tissues, but no GO terms were enriched in the overlapping sets of transcripts.
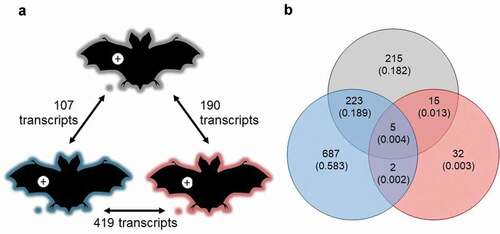
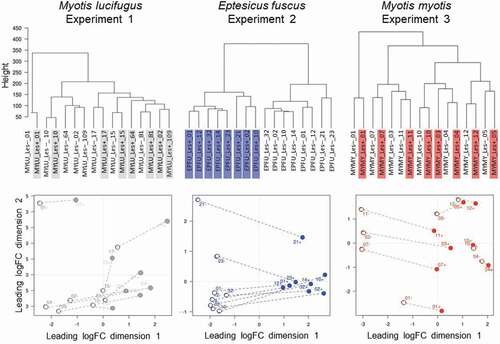
Figure 4. The response of Pseudogymnoascus destructans to growth in lesions on bat wings overlapped among three host species, with no consistent, biologically meaningful, interspecific differences in expression of transcripts (no gene ontology categories were enriched). Dendrogram (a) and multi-dimensional scaling plot (b) show lack of clear clustering by host species for P. destructans growing on Myotis lucifugus (gray-shaded labels on left, gray dots on right); Eptesicus fuscus (blue-shaded labels on left; blue dots on right); and M. myotis (red-shaded labels on left; red dots on right).
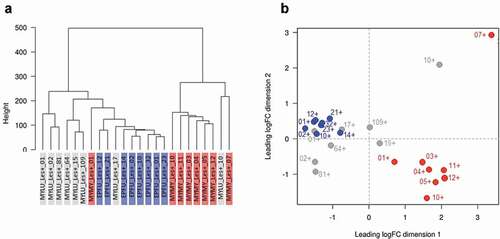
Table 1. Genes related to putative virulence factors, differentially expressed by Pseudogymnoascus destructans during growth in lesions on the wings of Myotis myotis (n = 8; red text), M. lucifugus (n = 8; gray text), and Eptesicus fuscus (n = 8; blue text).
Figure 5. Response of the wing tissue of bats with white-nose syndrome (WNS; n = 8 pairs of samples/species) to superficial growth of Pseudogymnoascus destructans on the wing (lesion-negative, unshaded labels on the dendrograms, above; open circles on the multi-dimensional scaling (MDS) plots, below), compared to growth in a fluorescing WNS lesion on the same individuals (lesion-positive; shaded labels on dendrograms, above; filled circles on the MDS plots, below). Dashed lines on the MDS plots indicate paired lesion-positive (+) and lesion-negative (-) samples from the same individual. Myotis lucifugus exhibits an apparent systemic response, with transcriptomes of lesion-negative samples most similar to the paired lesion-positive samples from the same individual. In contrast, Eptesicus fuscus mounts a localized response to P. destructans; gene expression is more similar between lesion-positive and lesion-negative groups of samples than between paired samples from individual bats. Myotis myotis, like its congener, exhibits a systemic response to WNS, but with less intraindividual variation than M. lucifugus.