Figures & data
Figure 1. Live adult schistosomes cleave ε-NAD. a. Male (blue squares) or female (red circles) worms, as indicated, were incubated with ε-NAD and mean fluorescence (±SEM) was measured over time, indicating cleavage. p < 0.001, 2-Way ANOVA, n ≥ 3. b. Structures of β-NAD (top) and ε-NAD (bottom); red circles indicate differences between the chemicals.
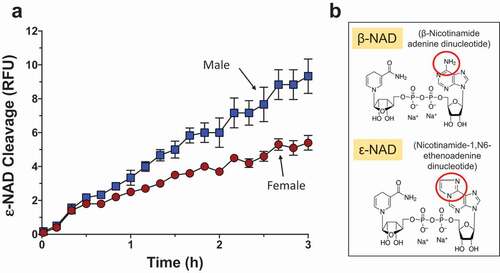
Figure 2. Adult worms prevent NAD induced T cell death (NICD) in vitro. Panels athrough gare representative (from one run) flow cytometry dot plots of purified T cells following various experimental treatments (described below) and panel h(right) represents composite data showing the mean percent total apoptotic T cells (± SEM) following these treatments in replicate. NAD was incubated at 37°C for 2 or 24 h with (panels cand f) or without (panels band e) adult schistosome parasites (male and female pairs). Equivalent amounts of NAD (25 µM, based on initial concentration) were added to cultures of purified T cells (2.5x10⁵cells/tube) for 30 min. Cells were then stained and subjected to flow cytometry. Controls include T cells incubated without NAD (Control, panel a) as well as cells incubated with worm culture medium that did not contain NAD (Worms, panels dand g). The “Key” at lower left indicates the cell status in each FACS plot quadrant (“live”, “early apoptotic”, “apoptotic” and “necrotic”). Panels b- dshow samples tested after the 2 h incubation period and panels e- gafter the 24 h incubation period. Of primary interest here, the percentages of total apoptotic cells (i.e. early plus late apoptosis; right upper and lower quadrants) are bounded by blue boxes in panels a- g. ****p < 0.0001 NAD v NAD + worms (one-way ANOVA at each time point), n ≥ 4 in each case.
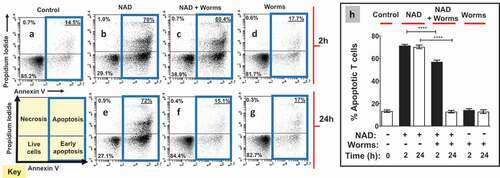
Figure 3. Purified recombinant SmNPP5 cleaves NAD. a. ε-NAD was incubated with 12.5, 25, or 50 ng of rSmNPP5, as indicated, and cleavage was assessed by an increase in fluorescence over time (n = 3, mean ± SEM) b. β-NAD was incubated with (+) or without (-) 1 µg rSmNPP5 for either 1 h or 5 h (as indicated) and phosphate levels (mean ±SEM) were assessed following CIP treatment. c. Thin Layer chromatography analysis of reaction products following NAD (black arrowhead) incubation with (+) or without (-) 1 µg rSmNPP5 for 1 h or 5 h (as indicated). Cleavage yields NMN (red arrowhead) and AMP (green arrowhead). Migration of standards is shown at left. NAD, nicotinamide adenine dinucleotide; NMN, nicotinamide mononucleotide; AMP, adenosine monophosphate. d. Depiction of NAD cleavage reaction catalyzed by SmNPP5; structures of NAD and cleavage products NMN and AMP are shown.
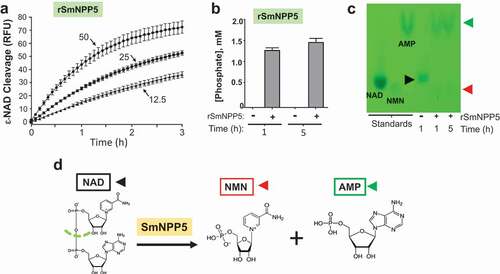
Figure 4. Recombinant SmNPP5 prevents NAD induced T cell death (NICD)in vitro. Panels athough dare representative flow cytometry dot plots of purified T cells following exposure to NAD (panel b) or not (Control, panel a) or to NAD that had been incubated with1 µg rSmNPP5 for 1 hour (panel c) or for 5 hours (panel d). The “Key” depicted in (lower left) applies here too; the percentages of total apoptotic cells are bounded by blue boxes. Panel erepresents composite data from replicate experiments, showing the mean percent total apoptotic T cells (± SEM) following the treatments indicated. *p<0.05 1 h v 5 h, ****p<0.0001+ NAD at time 0 v all other groups, One-way ANOVA, n≥4 in each case.
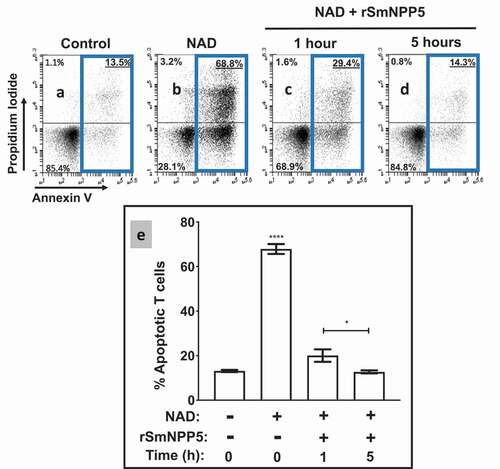
Figure 5. Knockdown of SmNPP5, but not SmNACE, reduces the ability of adult schistosomes to cleave extracellular ε-NAD. Adult male worms were treated with the indicated siRNAs. Seven days later the mRNA levels of SmNPP5 (left) and SmNACE (right) were assessed by RT-qPCR, shown in a. Average expression level (±SEM) is reported relative to the Control treatment, set at 100%. In b, the ability of siRNA treated individual worms from each group to cleave ε-NAD (mean RFU ±SEM,) over time is shown. ***p<0.0001 for SmNPP5 or SmNPP5/SmNACE compared to Control, None, and SmNACE groups, 2-way ANOVA with Tukey’s multiple comparisons test, n≥5 for each group.
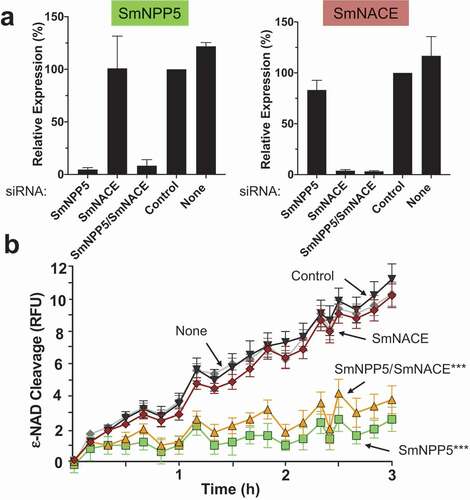
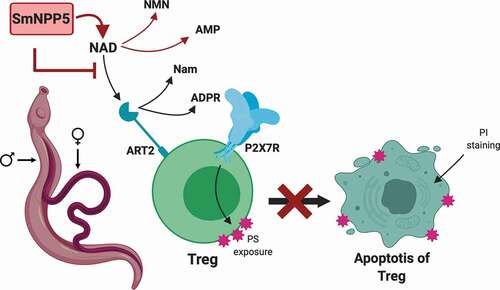
Figure 6. Diagrammatic representation of NAD induced T cell death (NICD) and its inhibition by rSmNPP5 and live schistosomes. A Treg cell is depicted (green) with its surface P2X7 receptor (P2X7R, blue) and ADPR ribosyl transferase ART2 (teal). NAD is a substrate for ART2 which generates nicotinamide (Nam) and ADPR; transfer of ADPR to P2X7R triggers apoptosis and this process results in exposure of phosphatidylserine (PS, pink star shapes) at the T cell surface. Cell membrane permeability increases which permits propidium iodide (PI) entry and signals late-stage apoptosis. Adult male and female schistosomes (left), through the action of surface ectoenzyme SmNPP5 (pink box), cleave extracellular NAD to NMN and AMP thus removing the ART2 substrate and preventing NAD induced Treg apoptosis.