
Figures & data
Figure 1. Nucleocytoplasmic trafficking of M protein promotes the replication and cytopathogenicity of NDV by affecting viral RNA synthesis and transcription. (a) The subcellular localization of M protein in rSS1GFP- and rSS1GFP-M/NLSm-infected BSR-T7/5 cells at 6, 12, 18 and 24 hpi. DAPI was used to stain nuclei. Original magnification was 1 × 200. (b) Virus titers were detected in BSR-T7/5 cells at the indicated time points. (c) The CPE and GFP were observed in virus-infected BSR-T7/5 cells at 12 and 24 hpi. Original magnification was 1 × 200. (d) The viral RNA synthesis corresponding to the NP and P genes and (e) viral transcription corresponding to the M and GFP genes in rSS1GFP- and rSS1GFP-M/NLSm-infected BSR-T7/5 cells were detected by qRT-PCR. (f) The expression levels of NP, M and GFP proteins in rSS1GFP- and rSS1GFP-M/NLSm-infected BSR-T7/5 cells were examined by Western blotting. The relative levels of the NP, M and GFP proteins were compared with the control GAPDH expression. Each data indicates the mean ± SD of three independent experiments. P-values are indicated by asterisks (*P < 0.05, **P < 0.01, ***P < 0.001 compared to the value of rSS1GFP-M/NLSm).
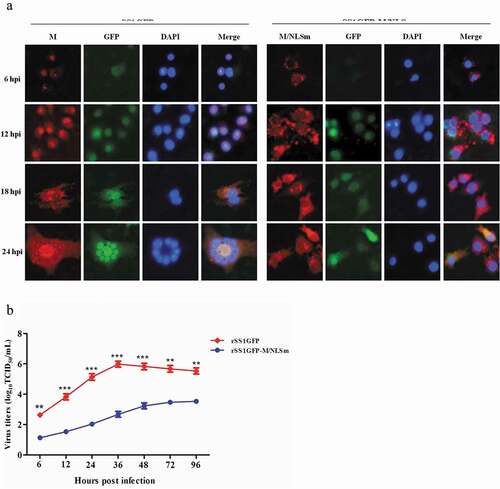
Figure 1. (Continued).
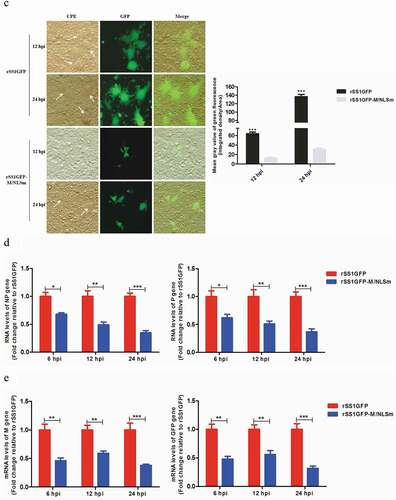
Figure 1. (Continued).
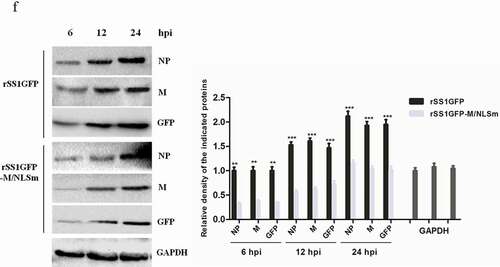
Table 1. Summary of MS/MS spectrum database search analysis.
Table 2. Significantly DEPs jointly shared by rSS1GFP and rSS1GFP-M/NLSm at 12 hpi and 24 hpi.
Figure 2. Workflow for TMT-coupled LC-MS/MS analysis of BSR-T7/5 cells infected with rSS1GFP and rSS1GFP-M/NLSm viruses.
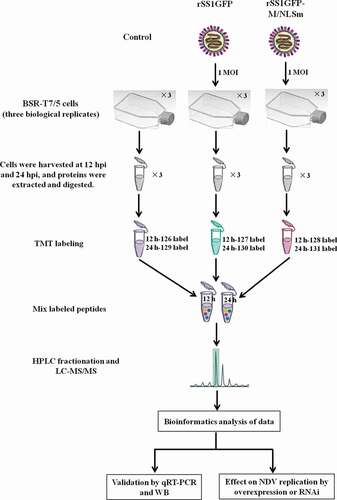
Figure 3. MS identified information based on proteomics analysis of DEPs in BSR-T7/5 cells infected with rSS1GFP and rSS1GFP-M/NLSm. (A) Average peptide mass error. (B) All identified peptides length distribution. (C) Numbers of DEPs during infection with rSS1GFP or rSS1GFP-M/NLSm virus relative to mock infection at 12 and 24 hpi. (D) The distribution of DEPs during rSS1GFP or rSS1GFP-M/NLSm infection at 12 and 24 hpi using Venn diagram analysis.
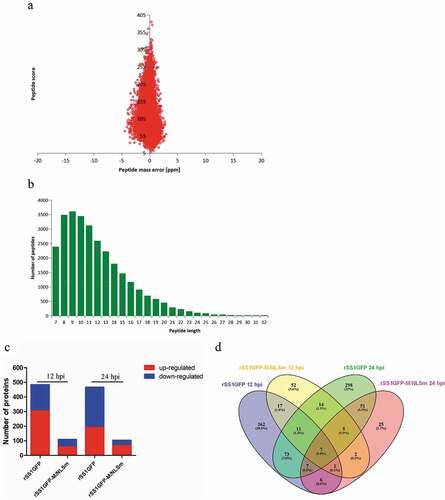
Figure 4. Enrichment analysis of the identified DEPs during rSS1GFP and rSS1GFP-M/NLSm infection . GO enrichment analysis on the ontology of cellular component, biological process and molecular function during rSS1GFP and rSS1GFP-M/NLSm infection at 12 hpi (a) and 24 hpi (b), respectively. KEGG enrichment analysis of the DEPs during rSS1GFP and rSS1GFP-M/NLSm infection at 12 hpi (c) and 24 hpi (d), respectively.
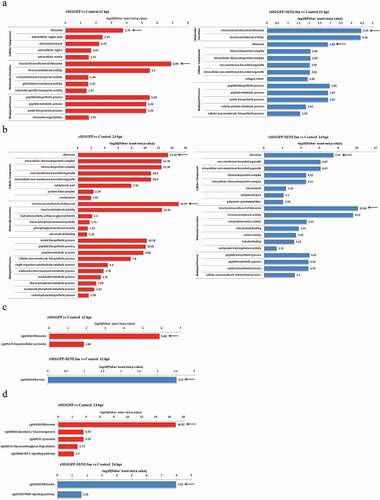
Figure 5. Analysis of the ribosome-related protein changes during rSS1GFP and rSS1GFP-M/NLSm infection. (a) The hierarchical clustering heatmap of ribosome-related proteins during rSS1GFP and rSS1GFP-M/NLSm infection at 12 and 24 hpi. The color scale bar locates in the right, and blue and red indicate decreased and increased levels of the identified DEPs, respectively. The modeling of ribosome signaling pathway in BSR-T7/5 cells infected with rSS1GFP (b) or rSS1GFP-M/NLSm (c) at 12 and 24 hpi, respectively (red, up-regulated DEPs; green, down-regulated DEPs; yellow, both up-regulated and down-regulated DEPs).
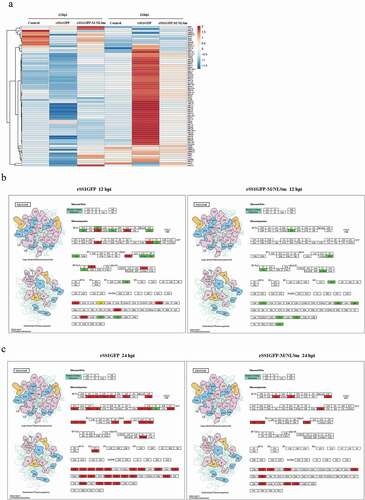
Figure 6. COG/KOG functional classification distribution maps of DEPS in BSR-T7/5 cells infected with rSS1GFP and rSS1GFP-M/NLSm at 12 hpi (a) and 24 hpi (b), respectively. A total of 24 groups of DEPs were clustered based on orthologous groups.
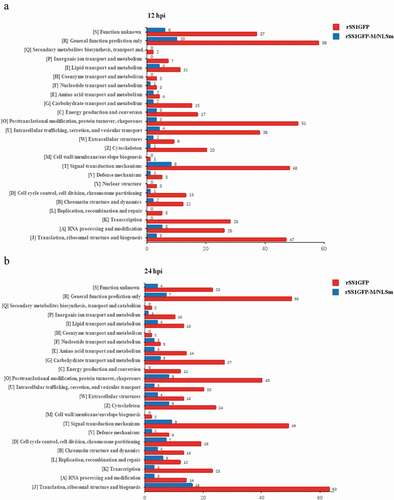
Figure 7. rSS1GFP infection inhibits host cell transcription, RNA processing and modification. (a) The heatmap of representative 20 DEPs related to “Transcription” during rSS1GFP and rSS1GFP-M/NLSm infection at 12 and 24 h. (b) The protein-protein interactions of the DEPs related to “Transcription” are analyzed by the STRING software. A red line indicates the presence of fusion evidence; a blue line indicates co-occurrence evidence; a light blue line indicates database evidence; a purple line indicates experimental evidence; a green line indicates neighborhood evidence; a black line indicates co-expression evidence. (c) The heatmap of representative 20 DEPs related to “RNA processing and modification” during rSS1GFP and rSS1GFP-M/NLSm infection at 12 and 24 h. (d) The protein-protein interactions of the DEPs related to “RNA processing and modification” are analyzed by the STRING software. (e) The mRNA expression levels of four selected DEP genes in BSR-T7/5 cells infected with rSS1GFP and rSS1GFP-M/NLSm were verified by qRT-PCR. (f) The protein expression levels of four DEPs in BSR-T7/5 cells infected with rSS1GFP and rSS1GFP-M/NLSm were examined by Western blotting. The relative expression levels of four DEPs were compared with the control GAPDH expression. Error bars represent standard deviations (mean ± SD) (*P < 0.05; **P < 0.01; ***P < 0.001 compared to the value of rSS1GFP-M/NLSm).
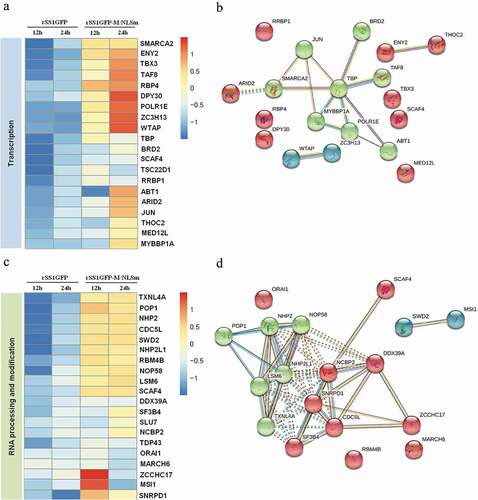
Figure 7. (Continued).
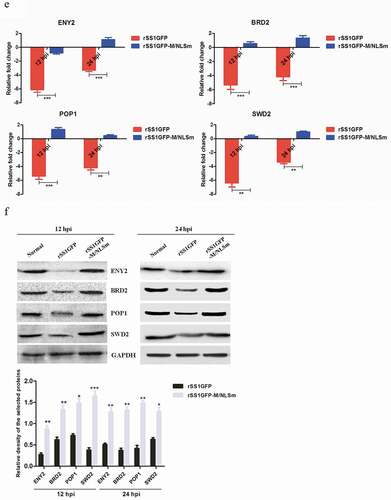
Figure 8. rSS1GFP infection affects the expression of cellular translation, posttranslational modification and trafficking-associated proteins. (a) The heatmap of representative 20 DEPs related to “Translation, ribosomal structure and biogenesis” during rSS1GFP and rSS1GFP-M/NLSm infection at 12 and 24 h. (b) The protein-protein interactions of the DEPs related to “Translation, ribosomal structure and biogenesis” are analyzed by the STRING software. A red line indicates the presence of fusion evidence; a blue line indicates co-occurrence evidence; a light blue line indicates database evidence; a purple line indicates experimental evidence; a green line indicates neighborhood evidence; a black line indicates co-expression evidence. (c) The heatmap of representative 20 DEPs related to “Posttranslational modification, protein turnover, chaperones” during rSS1GFP and rSS1GFP-M/NLSm infection at 12 and 24 h. (d) The protein-protein interactions of the DEPs related to “Posttranslational modification, protein turnover, chaperones” are analyzed by the STRING software. (e) The heatmap of representative 20 DEPs related to “Intracellular trafficking, secretion, and vesicular transport” during rSS1GFP and rSS1GFP-M/NLSm infection at 12 and 24 h. (f) The protein-protein interactions of the DEPs related to “Intracellular trafficking, secretion, and vesicular transport” are analyzed by the STRING software. (g) The mRNA expression levels of six selected DEP genes in BSR-T7/5 cells infected with rSS1GFP and rSS1GFP-M/NLSm were verified by qRT-PCR. (h) The protein expression levels of six DEPs in BSR-T7/5 cells infected with rSS1GFP and rSS1GFP-M/NLSm were examined by Western blotting. The relative expression levels of six DEPs were compared with the control GAPDH expression. Error bars represent standard deviations (mean ± SD) (*P < 0.05; **P < 0.01; ***P < 0.001 compared to the value of rSS1GFP-M/NLSm).
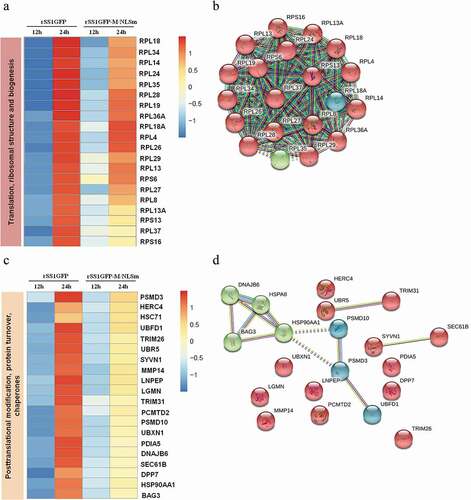
Figure 8. (Continued).
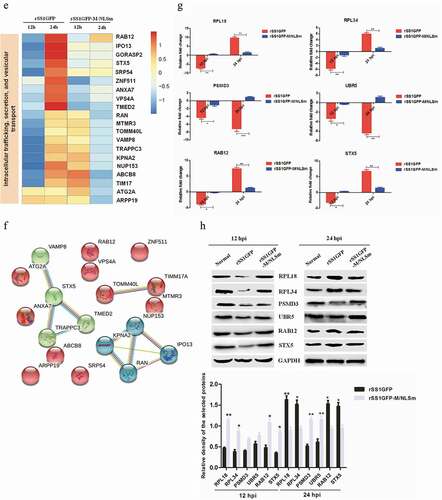
Figure 9. rSS1GFP replication is enhanced by inhibiting TIFA/TRAF6/NF-κB signaling pathway later in infection. (a) The mRNA expression levels of TIFA gene in BSR-T7/5 cells infected with rSS1GFP and rSS1GFP-M/NLSm were verified by qRT-PCR. (b) The protein expression levels of TIFA in BSR-T7/5 cells infected with rSS1GFP and rSS1GFP-M/NLSm were examined by Western blotting. The relative expression levels of TIFA were compared with the control GAPDH expression. (c) The subcellular localization of EGFP-M or EGFP-M/NLSm and HA-TIFA in plasmids co-transfected BSR-T7/5 cells. Original magnification was 1 × 200. (d) The effect of different dosage EGFP-M or EGFP-M/NLSm on the expression level of endogenous TIFA in plasmid transfected BSR-T7/5 cells. The relative expression levels of TIFA were compared with the control GAPDH expression. (e) The expression patterns of TIFA, pTIFA, TRAF6, NF-κB p65, pNF-κB p65, and IL-2 in BSR-T7/5 cells infected with rSS1GFP and rSS1GFP-M/NLSm at 12 and 24 hpi. The relative expression levels of these proteins were compared with the control GAPDH expression. (f) The effect of TIFA overexpression on the expression of IL-2 and virus titers of rSS1GFP and rSS1GFP-M/NLSm at 12 and 24 hpi. (g) The effect of siRNA-mediated knockdown of TIFA on the expression of IL-2 and virus titers of rSS1GFP and rSS1GFP-M/NLSm at 12 and 24 hpi. (h) The schematic diagram illustrated that the M protein in the cytoplasm inhibited host cell immune response by down-regulating TIFA/TRAF6/NF-κB signaling pathway.
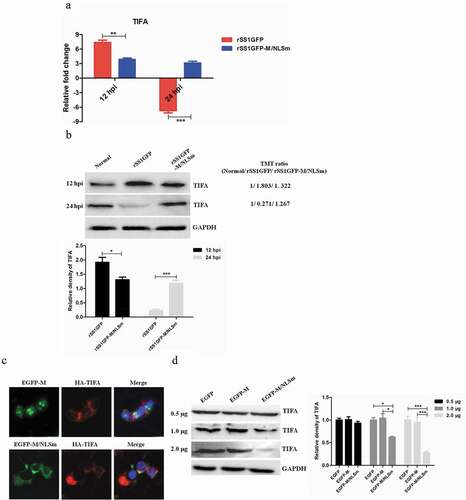
Figure 9. (Continued).
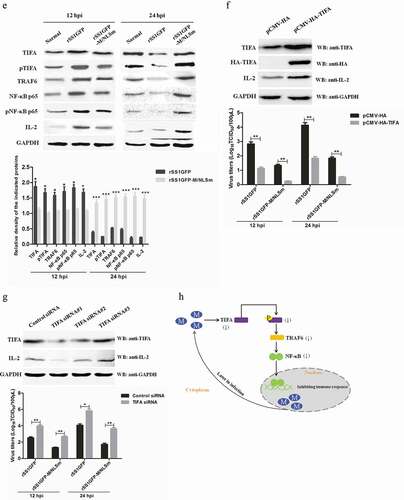
Figure 10. The schematic diagram of the potential functions of M’s nucleocytoplasmic trafficking. Replication and transcription of NDV genome occurs in the cytoplasm via the action of viral ribonucleoprotein (RNP) complexes. During the course of NDV infection, the M protein localizes to the nucleus early in infection and enters the cytoplasm and binds to the cellular plasma membrane later in infection. The potential functions of M protein in the nucleus and the cytoplasm are indicated according to our findings.
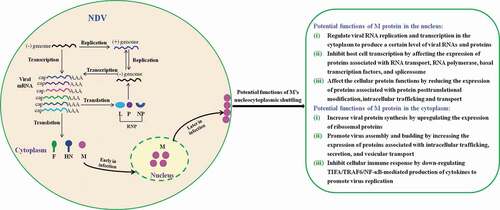
Table 3. Quantitative real-time PCR primers used in this study.