
Figures & data
Table 1. Antimicrobial susceptibility test.
Table 2. FICs of antimicrobials against coci.
Table 3. Frequency of resistance to IDAR.
Figure 1. IDAR exhibits bactericidal activity against MRSA and persister cells. (a) Disk diffusion assay of IDAR showing activity against S. aureus ATCC 43300. The amounts of VAN, CIP, and IDAR were 20 μg, 5 μg, and 20 μg per disk, respectively. (b) Dose-dependent efficacy of IDAR against ATCC 43300 determined by the broth microdilution assay. (c) Cell growth inhibitory effects of IDAR at 0.5–4 × MIC against ATCC 43300 at different timepoints. (d) Time-dependent bactericidal effects of IDAR against ATCC 43300 at concentrations ranging from 0.5 to 4 × MIC. (e) Persister cells induced by RIF at 100 × MIC, followed by treatment with 8 μg/ml IDAR for a total of 6 h. Viable cell counts were recorded by the serial dilution method. (f) Appearance of ATCC 43300 spontaneous resistance in the presence of IDAR and CIP over 16 d of serial passage in duplicate (P1 and P2). (g) MRSA antimicrobial effects of 8 h of treatment with an ointment containing IDAR (0.8%, wt/wt) in an acute wound model infected by ATCC 43300.
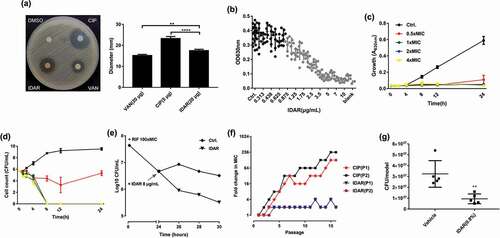
Figure 2. IDAR inhibits biofilm formation and eradicates preformed biofilms. (a) Dose-dependent biofilm inhibitory effects of IDAR against MRSA biofilms by the CV staining method. (b) Representative CLSM images and (c) fluorescent intensity quantification by ZEN 2012 software of IDAR biofilm inhibitory effects. The concentration of both VAN and IDAR was 2 μg/ml. (d) Biofilm eradication by IDAR as demonstrated by the CV staining method. (e) Representative CLSM images and (f) fluorescent intensity quantification by ZEN 2012 software of IDAR biofilm eradication effects.
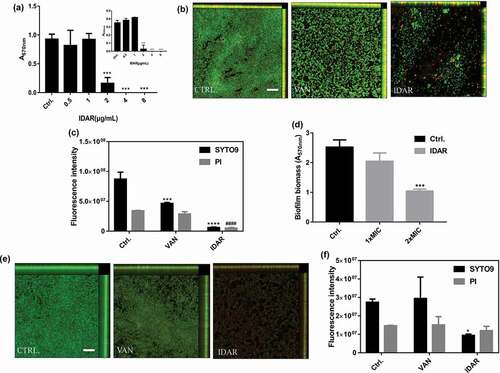
Figure 3. IDAR disrupted the cell membrane and interacted with the DNA Topo IIA subunits GyrA and GyrB. (a) Representative configurations of MD simulations of IDAR from left to right: onset, membrane attachment, membrane penetration, and equilibrium interaction with 7DOPC/3DOPG lipid bilayers. (b) Interaction model between IDAR and phospholipid groups. (c) The free-energy profiles of IDAR penetrating into the indicated lipid bilayers as a function of the interaction time with the bilayer. (d) TEM showing mesosome-like structures (red arrow), cell wall disruption (green arrow), abnormal intracellular aggregation (blue arrow), cell membrane disruption (white arrow), and cell lysis in 5 × MIC IDAR-treated cells and DMSO controls. (e) Uptake of SYTOX Green (green line) and viable cell counts (red line) by exponential-phase S. aureus ATCC 43300 cells treated with IDAR. (f) Model of the interaction between IDAR and GyrA and GyrB by molecular docking analysis. (g) Affinity between IDAR and the GyrA and GyrB proteins by SPR analysis. (h) Inhibition of S. aureus gyrase activity by CIP and IDAR.
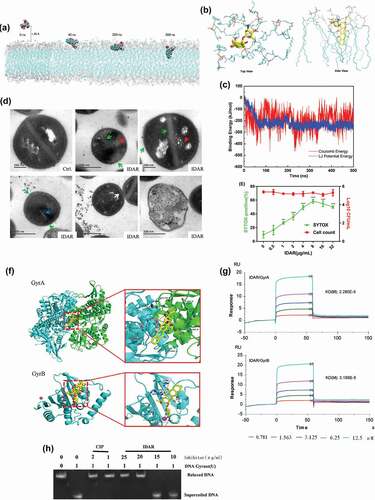
Figure 4. Synergistic effects between IDAR and FOS against MRSA planktonic cells and biofilms. (a) Drug interaction determined by a disk diffusion assay. (b) Drug interaction determined by a checkerboard assay. The red circle indicates the optimal combination with the lowest FICI. (c) Time-kill curve of drugs in combination or used alone. (d) Antibiofilm effects by IDAR and FOS alone or in combination demonstrated by XTT staining. (e) Representative CLSM images of antibiofilm effects of IDAR and FOS alone or in combination.
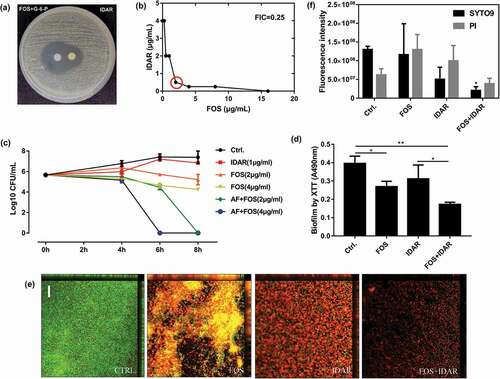
Figure 5. AMI relieved the cytotoxicity of IDAR in mammalian cells. (a) Sheep blood hemolytic activity of IDAR. DMSO was included as a control. (b) Effects of AMI on the antimicrobial effects of IDAR determined by a checkerboard assay. (c) BEL-7404, (d) HcoEpiC, and (e) HSF IDAR cytotoxicity determined by CCK-8 assays. (f) IC50 of IDAR in the presence/absence of AMI. In vivo toxicity of IDAR to the liver (g), kidney (h), and cardiac system (i) after 24 h of treatment in a mouse model.
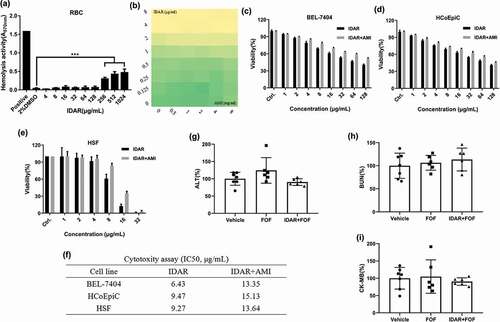
Figure 6. IDAR synergy with FOS eradicates MRSA in a subcutaneous abscess mouse model. Size (a) and bacterial load (b) of abscesses after treatment with IDAR (1–4 mg/kg, s.c.) in the presence/absence of FOS (20 mg/kg, s.c.) for 3 d. (c) Representative images of subcutaneous abscesses before and after IDAR treatment.
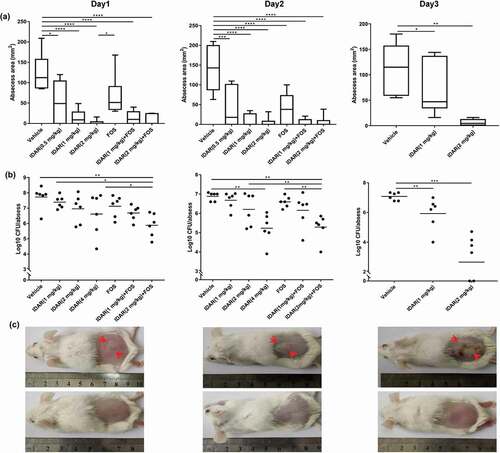
Figure 7. Antimicrobial model of the mechanism of IDAR. Red lighting indicates the target of IDAR. IDAR penetrates the cell wall into the cell membrane, disrupts the normal structure of the phospholipid bilayer, and in addition, some IDAR penetrates the cytoplasm and interacts with the topoisomerase IIA subunits GyrA and GyrB, inhibiting DNA replication and cell growth and showing bactericidal effects.
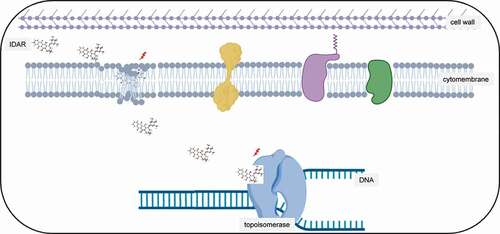
Table 4. PAEs of inhibitory and subinhibitory concentrations of the antimicrobial compounds tested in this study.
Table 5. MIC and MBC of anthracycline drugs against S. aureus.