Figures & data
Table 1. Primers and probes*.
Figure 1. Preparation of plasmid standards. A-D: amplification curves (X-axis: Cycle, Y-axis: Fluorescence) of PEDV, PDCoV, PToV, and SADS-CoV for each plasmid standard of concentrations with 1 × 10⁷ copies/μL to 1 × 101 copies/μL; E-H: standard curves of plasmid standards of PEDV, PDCoV, PToV, and SADS-CoV. All standard curves were conducted with software GraphPad Prism 8.
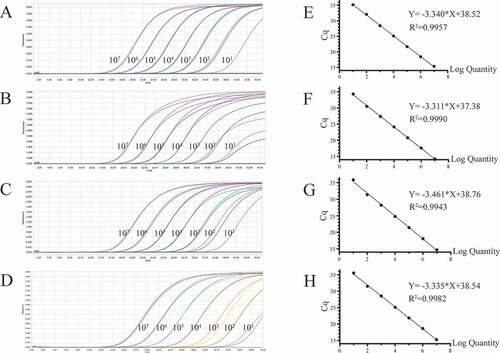
Table 2. Cq values of PEDV, PDCoV, PToV, and SADS-CoV detected by this multiplex real-time PCR assay with different probe and primer concentrations.
Figure 2. A-D: amplification curves (X-axis: Cycle, Y-axis: Fluorescence) of PEDV, PDCoV, PToV, and SADS-CoV detected by multiplex real-time PCR with different probe and primer concentrations. Plasmid standards with concentration of 1 × 10³ copies/μL were chosen as templates for the reactions. The four green lines are the amplification curves of four fluorescence of the most suitable reaction tube.
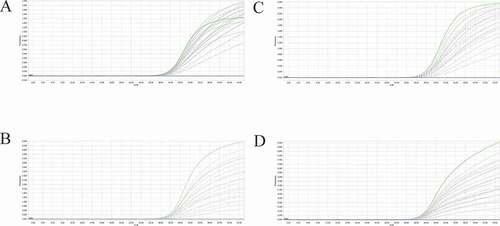
Table 3. Sensitivity of the multiplex real-time PCR assay.
Figure 3. A: amplification curves (X-axis: Cycle, Y-axis: Fluorescence) of 10-fold serial dilutions (1 × 10⁷–1 × 101 copies/μL) of plasmid standards of PEDV, PDCoV, PToV, and SADS-CoV detected by multiplex real-time PCR. B: four amplification curves represent samples positive for PEDV, PDCoV, PToV, and SADS-CoV detected by our multiplex real-time PCR assay; negative samples include TGEV, PoRV, PSV, PTV, CSFV, PKV, and negative control.
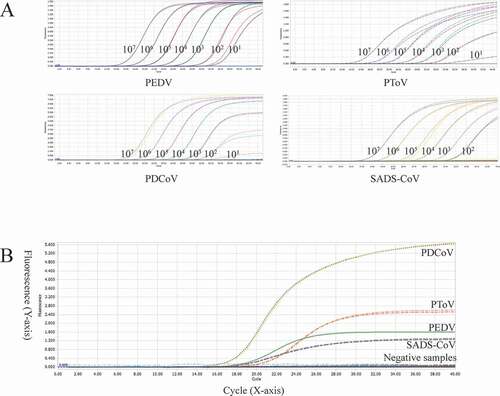
Figure 4. Co-infection simulation experiments with two pathogens. A-F: amplification curves (X-axis: Cycle, Y-axis: Fluorescence) of PDCoV + SADS-CoV, PDCoV + PToV, PEDV + SADS-CoV, PEDV + PDCoV, PEDV + PToV, PToV + SADS-CoV at concentrations of 1 × 10³ copies/μL; G-L: amplification curves of PDCoV + SADS-CoV, PDCoV + PToV, PEDV + SADS-CoV, PEDV + PDCoV, PEDV + PToV, PToV + SADS-CoV at concentrations of 1 × 10² copies/μL. Two replicates were set per reaction.
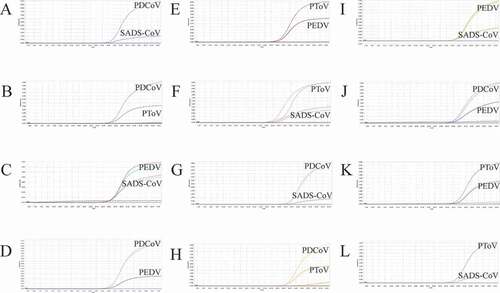
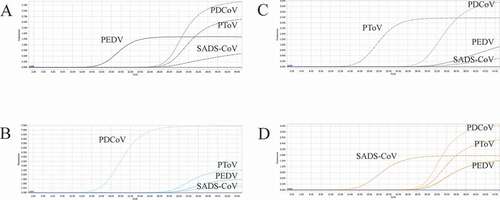
Figure 5. Co-infection simulation experiments with three pathogens. A-D: amplification curves (X-axis: Cycle, Y-axis: Fluorescence) of PDCoV + PToV + SADS-CoV, PEDV + PToV + SADS-CoV, PEDV + PDCoV + SADS-CoV, PEDV + PDCoV + PToV with concentration of 1 × 10³ copies/μL; E-H: amplification curves of PDCoV + PToV + SADS-CoV, PEDV + PToV + SADS-CoV, PEDV + PDCoV + SADS-CoV, PEDV + PDCoV + PToV with concentrations of 1 × 10² copies/μL. Two replicates were set per reaction.
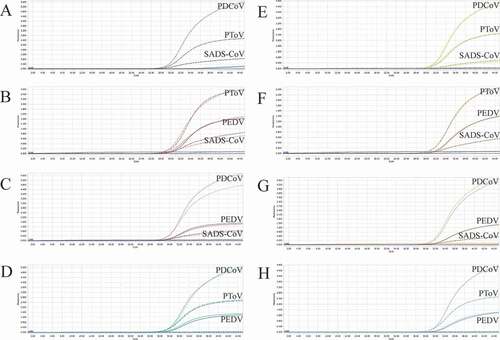
Figure 6. Co-infection simulation experiments with four pathogens. A-B: amplification curves (X-axis: Cycle, Y-axis: Fluorescence) of PEDV + PDCoV + PToV + SADS-CoV at concentrations of 1 × 10² copies/μL and 1 × 10⁷ copies/μL. Two replicates were set per reaction.
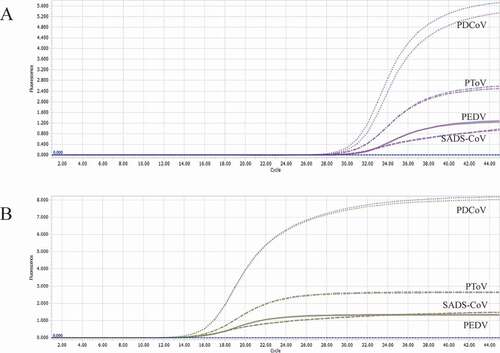
Figure 7. Co-infection of all the four pathogens at different concentrations. A: the concentration of plasmid standard of PEDV was 1 × 10⁷ copies/μL and the others were 1 × 10² copies/μL; B: the concentration of plasmid standard of PDCoV was 1 × 10⁷ copies/μL and the others were 1 × 10² copies/μL; C: the concentration of plasmid standard of PToV was 1 × 10⁷ copies/μL and the others were 1 × 10² copies/μL; D: the concentration of plasmid standard of SADS-CoV was 1 × 10⁷ copies/μL and the others were 1 × 10² copies/μL. Two replicates were set per reaction. X-axis: Cycle, Y-axis: Fluorescence.