Figures & data
Figure 1. (a). PCA scores plots, (b). OPLS-DA scores plots, (c). VIP-plot of OPLS-DA for serum samples of the co-infection group (blue) versus healthy controls (red) in negative and positive ion mode (label 1, 2). Log2 (fold change) is the abscissa, and the negative logarithm of q-value is the ordinate in (C). The red points represent fold change ≥ 1.2 or ≤ 0.8333 and q-value < 0.05, and the remaining points are gray.
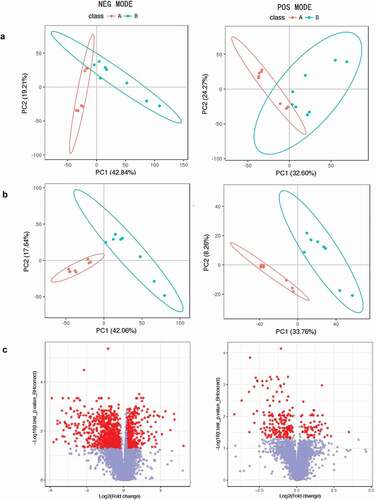
Figure 2. (a). Bubble plot of pathway analysis with MetaboAnalyst of potential metabolites in serum. (b). A correlation network of potential metabolites analysis with Metscape in serum. The regular hexagon indicate potential biomarkers, blue lines represent positive correlation, and red lines represent negative correlation. (c). The heat map of metabolites related to the arachidonic acid metabolic pathway.
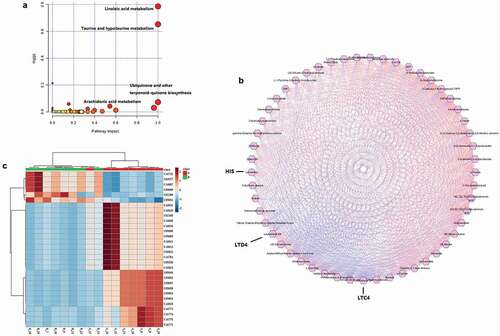
Figure 3. 7 genes and 13 metabolites in the co-infection group metabolic signature mapped onto the arachidonic acid pathway (Arachidonic acid structure as shown in it). Relative expressions are shown as box (metabolites) and column (genes) plots, red for control group and green for co-infection group. The ordinate of the box plot is the ionic strength, and the ordinate of the column plot is Log2 (fold change) or FPKM (gene expression). Bars represent the mean ± SD. The values with star differ significantly (with “*”, 0.01 < P < 0.05) or very significantly (with “**”, P < 0.01) between Group A and B.
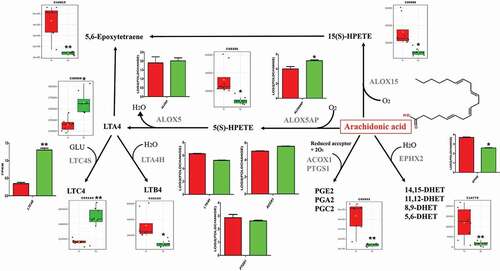
Figure 4. LTC4, LTD4, HIS, NO were detected by ELISA in serum, lung and tracheal tissues and performed with scatter plot. Bars represent the mean ± SD. The values with star differ significantly (with “*”, 0.01 < P < 0.05) or very significantly (with “**”, P < 0.01) between Group A and B.