Figures & data
Figure 1. Kaplan-Meier survival curves of G. mellonella challenged with a range of SAMTB lux inocula over a 96 h time course.
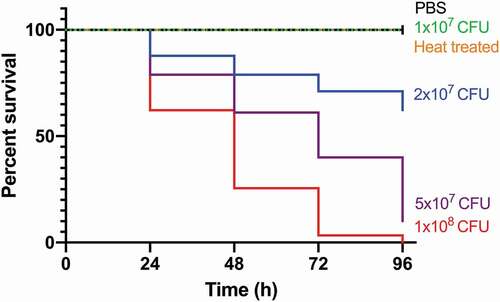
Figure 2. In vivo proliferation of SAMTB lux in G. mellonella larvae over a 168 h time course.
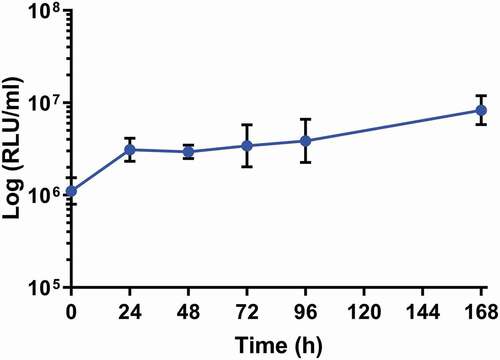
Figure 3. Recovery of SAMTB lux from larval homogenate over a 168 h time course.
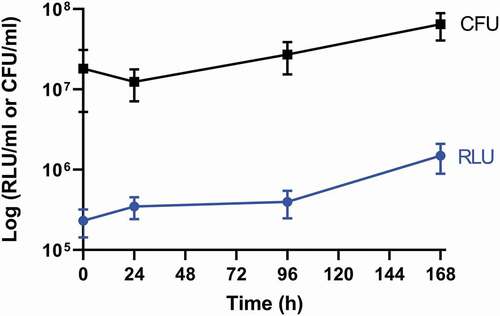
Figure 4. Histological analysis of G. mellonella-SAMTB lux interaction over time.
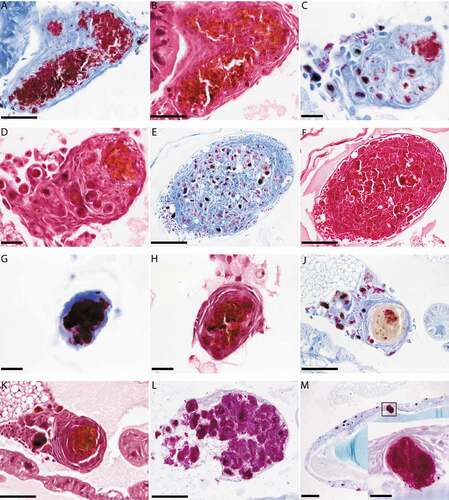
Figure 5. Cross sectional view of whole larvae infected with SAMTB lux.
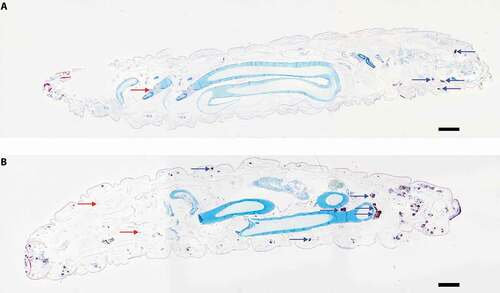
Figure 6. SAMTB lux associates with hemocytes following infection.
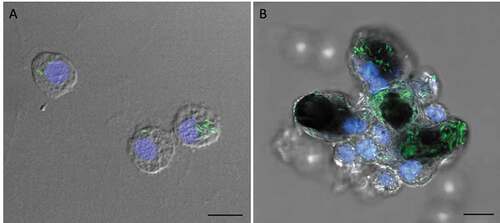
Figure 7. Interaction between SAMTB lux and phagocytic hemocytes.
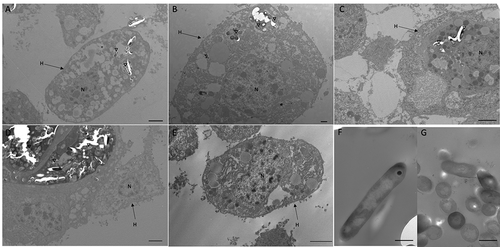
Figure 8. Changes in hemocyte counts in SAMTB lux infected larvae.
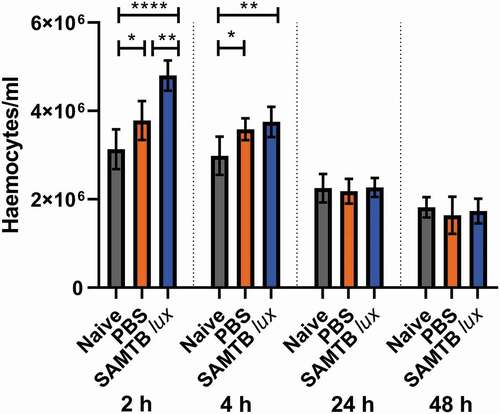
Figure 9. The effect of first-line and second-line antibiotics on the reduction of SAMTB lux bioluminescence within G. mellonella over a 96 h time course.
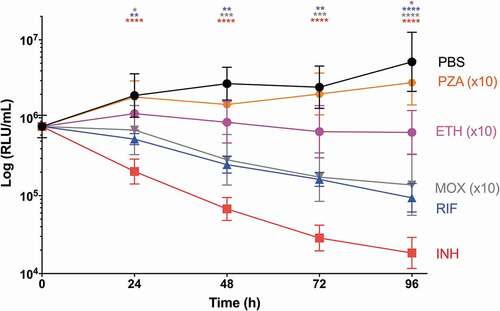
Figure 10. The effect of INH and RIF concentration on the reduction of SAMTB lux bioluminescence within G. mellonella.
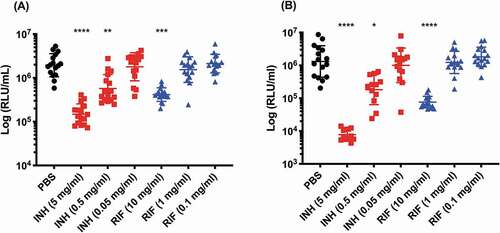
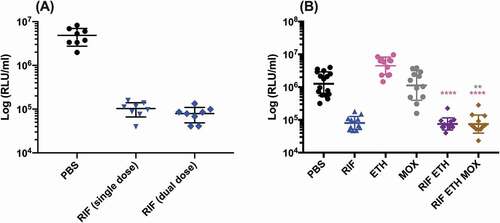
Figure 11. The effect of RIF multiple dosing and RIF combination drug therapy on the reduction of SAMTB lux bioluminescence within G. mellonella.