Figures & data
Figure 1. Interactions of P. aeruginosa’s with alveolar and bronchial lung epithelial cells. The adhesion and invasion values of P. aeruginosa PAO1, PA14, PAET1, PAET2 and PAET4 to A549, 16HBE14o- and CFBE41o- cells. The different plots show the log10 CFUs of each strain counted as adhered (adhered + invaded) and as only intracellularly invaded per monolayer of the different epithelial cells. Three independent experiments are plotted in each graph, and the error bars indicate the standard error of the mean from representative triplicate experiments. Statistical significance between the adhered and the invaded log10 of each strain CFU/monolayer point is indicated with an asterisk (*p < 0.05; ** p < 0.01; *** p < 0.001).
Table 1. Percentage (mean±SD) values of the P. aeruginosa invasion rate per lung cell after 3 h of infection at a MOI = 100.
Figure 2. Differential pattern of intracellular persistence among the Pseudomonas strains depending on the lung epithelial cell type. The figure shows the log10 CFUs/monolayers of PAO1, PA14, PAET1, PAET2, and PAET4 after 1.5, 3, 4.5, 6 and 21 h incubation with gentamicin 200 µg/mL after 3 h of infection at a MOI = 1. The standard error of the mean from representative triplicate experiments is indicated with the error bars. Significant differences between the CFUs counted per monolayer between time points for each strain and cell line are indicated with asterisks (*p < 0.05; ** p < 0.01; *** p < 0.001; **** p < 0.0001).
Figure 3. Intracellular persistence of the P. aeruginosa reference and clinical strains does not affect lung cell viability. A549, 16HBE14o- and CFBE41o- toxicity after 24 h of intracellular persistence of PAO1, PA14, PAET1, PAET2, and PAET4. The plot shows the normalized values of the absorbance measured at A570 to the absorbance of the reference A600, as recommended by the PrestoBlueTM manufacturer. Higher absorbance values indicate greater metabolic activity and therefore viability. Data from three independent experiments are shown, and the error bars indicate the standard error of the mean of representative triplicate experiments. Untreated monolayers were used as controls for viability, and DMSO-treated cells were used as controls for toxicity. A representative picture of the PrestoblueTM-treated cells is included in the figure in which the gradient from pink (viable cells) to dark blue (toxic cells) is related to the level of cellular toxicity.
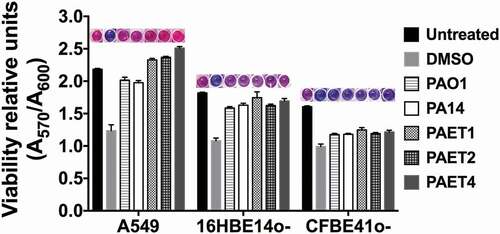
Figure 4. Oxygen consumption of A549, 16HBE14o- and CFBE41o- P. aeruginosa-infected monolayers. A) Fluorescence microscope images showing the red fluorescence emission of the hypoxia probe dye after 3 and 24 h of initial infection of the PAO1, PA14, PAET1, PAET2 and PAET4 strains. Uninfected A549, 16HBE14o- and CFBE41o- were also included as controls. The red-intensity signal relates to cellular hypoxia. The percentage of red intensity increases from 3 h to 24 h of intracellular persistence per infection and lung epithelial cell type and is included in the figure. The percentages were calculated with ImageJ software using the pixel intensity averages from ten different images of each infectious condition and time-point. B) Graphs showing the pixel intensity averages and the respective standard error of the mean of each P. aeruginosa intracellular infection of A549, 16HBE14o- and CFBE41o- cells incubated for 3 and 24 h. Significance differences among lung cell infections with the same P. aeruginosa strains are denoted with asterisks (*) p > 0.05.
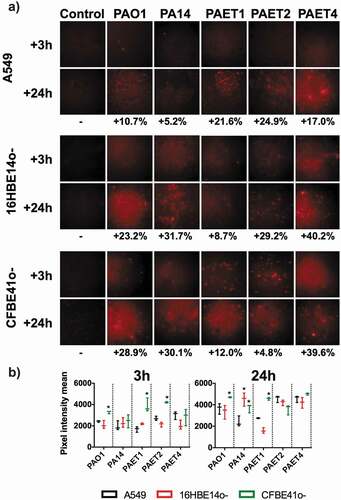
Figure 5. Shifting protein expression pattern among the reference and CF isolates of P. aeruginosa. The figure shows the picture of two SDS-PAGE gels with the protein extracts of the PAO1 and PA14 reference strains together with the PAET1, PAET2 and PAET4 CF-clinical isolates after 3 and 24 h of planktonic growth. While all P. aeruginosa strains shared similar protein pattern after 3 h of growth, it completely changed after 24 h, with a completely different protein expression profile between strains independently their background.
Figure 6. Different lung intracellular backgrounds promote differential RNR expression among P. aeruginosa strains. A) Intracellular NrdA, NrdJ and NrdD protein expression in P. aeruginosa PAO1-, PA14-, PAET1-, PAET2- and PAET4-infected A549, 16HBE14o- and CFBE41o- cells after 3 and 24 h are shown in the figure. The levels of extracellular P. aeruginosa NrdA, NrdJ and NrdD from the same strains grown in the extracellular phase (media) while infecting are also included. Specific NrdA, NrdD and NrdJ protein bands were selected according their molecular weight as given by antibodies binding to purified NrdA, NrdD and NrdJ proteins from our laboratory stock (Figure S1A). Unspecific bands of each independent Nrd protein immunoblot were used as loading controls, and the detection of purified NrdA (~107.1 kDa), NrdJ (~82.7 kDa) and NrdD (~76.1 kDa) proteins with polyclonal antibodies was used as the Nrd protein band detection control (Figure S1B). B) The different plots show the average of the number of pixels calculated in the volume of NrdA, NrdJ and NrdD protein bands using ImageQuantTM LAS4000 software. A higher pixel intensity in the protein band volume indicates higher expression of the target protein under a specific infection condition. Each plot compares the Nrd protein bands detected at 3 and at 24 h of intracellular persistence inside of A549, 16HBE14o- and CFBE41o- monolayers and includes the fold induction of each protein at the 24 h time-point. Protein induction was calculated using the average of the pixels determined from each protein band at both time-points, previously normalized by the average of the pixels determined in the respective unspecific band shown in (Figure S1B).
Figure 7. Intracellular expression of the P. aeruginosa’s nrd genes and their importance during the persistence of the bacterium inside the A549 cells. A) Fold-change induction of nrdA, nrdJ and nrdD gene expression in PAO1-, PA14-, PAET1-, PAET2- and PAET4-infected A549 after 24 h of intracellular infection compared to 3 h. The nrd gene induction was calculated relative to the endogenous control gapA and using the 2−ΔΔCT method. B) Percentages of intracellular survival for the PAO1 WT, PAO1 ΔnrdJ, PAO1 ΔnrdD and the respective PAO1 ΔnrdJ+pETS218 and PAO1 ΔnrdD+pETS197 complemented strains after 21 h of Gm treatment. Cb 300 μg/mL was included during the experiment in the conditions with the complemented strains to ensure plasmid maintenance.