Figures & data
Table 1. Primers used for QRT-PCR analysis.
Figure 1. Percent survival of crucian carp to A.sobrial infection at 18°C and 33°C. Crucian carp were acclimated at 18°C or 33°C for 7 days and then were challenged with saline or A.sobrial (1 × 10⁶CFU/dose; n = 30 for each treatment). The percent survival was monitored for 15 days.
Figure 2. Crucian carp had different metabolomics profiling when cultured at different temperatures.
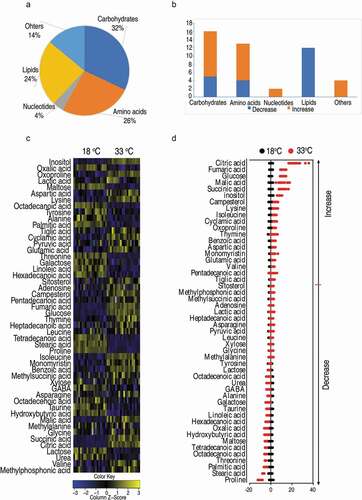
Figure 3. Pathway analysis of differential metabolites.
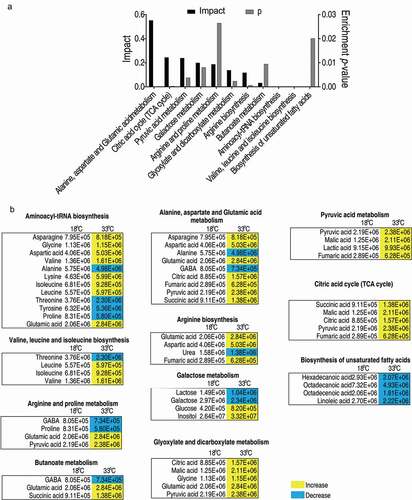
Figure 4. Metabolic network of the metabolites with differential abundance, and measurement of the activities of enzymes of the TCA cycle.
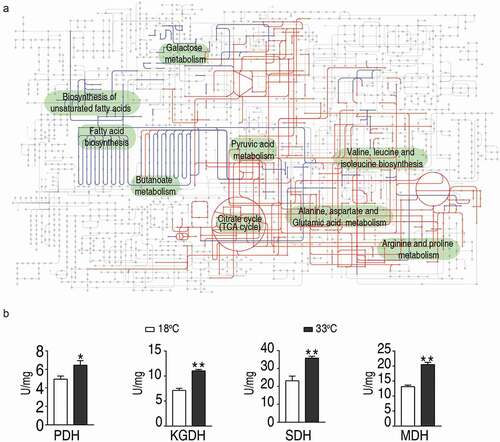
Figure 5. Maltose promotes fish survival against A. sobrial infection.
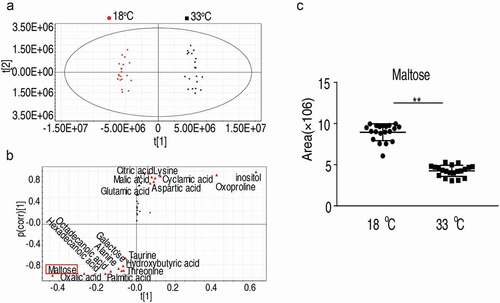
Figure 6. Maltose promotes fish survival against A.sobrial infection.
Figure 7. Maltose does not promote the activity of TCA cycle.
Figure 8. Maltose modulates innate immune response at 33°C.