Figures & data
Table 1. Bacterial strains and plasmids used in this study.
Figure 1. Construction of an isogenic htpsA mutant of S. suis 05ZYH33. (a) Schematic diagram of the construction process of the ΔhtpsA strain. (b) Combined PCRs of the ΔhtpsA mutant. (c) Reverse-transcription PCR analysis of htpsA gene transcripts. The primer pairs and templates used in the PCR analysis are indicated above the lanes. WT and ΔhtpsA represent genome DNA of the wild-type strain 05ZYH33 and mutant strain, respectively.
Figure 2. Phenotypic analysis of the 05ZYH33 and ΔhtpsA mutant strains. (a) Cell density was measured spectrophotometrically at a wavelength of 600 nm. (b) Antiserum aggregation reaction of the ΔhtpsA and 05ZYH33. (c) Observation of capsular morphology of the ΔhtpsA, ΔhtpsC, Δcps2B and the wild-type strains by transmission electron microscopy. (d) Determination and analysis of capsule thickness of the ΔhtpsA, ΔhtpsC, Δcps2B and wild-type strains. ** represents significant differences (P < 0.01), NS represents no significant differences.
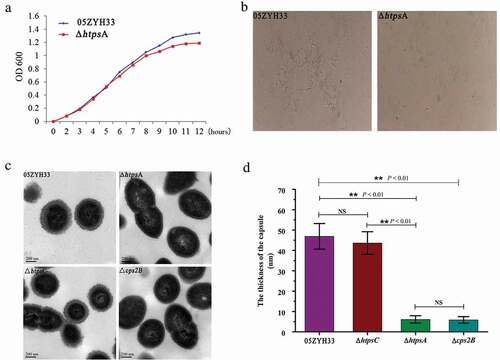
Figure 3. Effects of htpsA deletion on bacterial capsular sialic acid content. Determination of sialic acid content of the ΔhtpsA and the wild strain 05ZYH3. (** indicates P < 0.01, Student’s t-test).
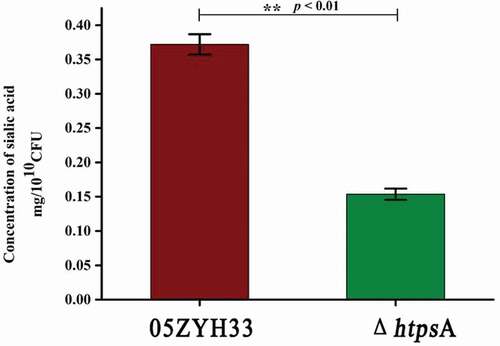
Figure 4. Effect of HtpsA deficiency on virulence and pathogenicity of bacteria. (a) Comparison of bacterial adherence capability of the ΔhtpsA mutant with the wild-type 05ZYH33 strain. The normalized mean fluorescence intensities (NMFI) of HEp-2 cells after incubation with the bacteria are shown as columns with standard errors. (b) Survival of the 05ZYH33 and ΔhtpsA mutant in human whole blood. Mixtures were incubated at 37°C for 8 hours, and then the dilutions were coated on agar plates. The number of single colonies that grew after incubating overnight was counted. (c) Evaluation of the anti-phagocytotic ability of S. suis strains in macrophage RAW264.7 cells (* indicates P < 0.05; ** indicates P < 0.01, Student’s t-test).
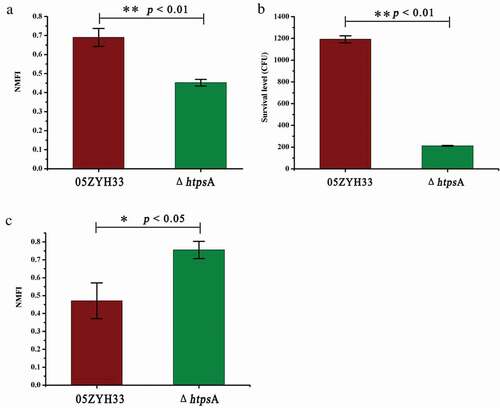
Figure 5. Survival curves of mice infected with the ΔhtpsA mutant or wild-type strain 05ZYH33 strains. Four-week-old BALB/c mice were challenged intraperitoneally with 1 × 10⁸ CFU bacteria, and the survival time was monitored. * represents a significant difference of P < 0.05, and ** represents a significant difference of P < 0.01.
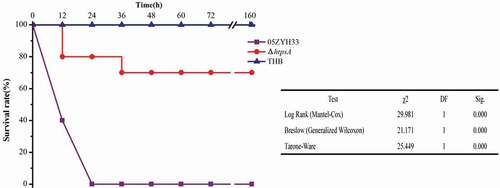
Table 2. Functional classification of differentially expressed genes between the ΔhtpsA mutant and 05ZYH33 strain.
Table 3. Classification of downregulated genes related to saccharometabolism.
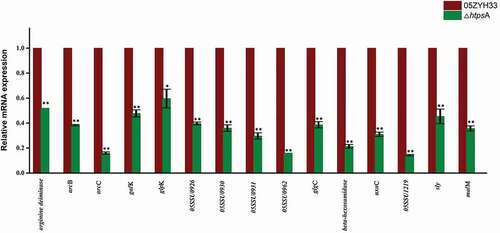
Figure 6. qRT-PCR validation of expression profiles of 15 differentially expressed genes identified by RNA-seq. The house-keeping gene gapdh was used as internal control, and error bars represent SEM of three replicates. * represents a significant difference of P < 0.05, and ** represents a significant difference of P < 0.01. Significant difference as determined by Student’s t-test.