Figures & data
Table 1. Phylogeny and main characteristics of the 30 investigated S. aureus ST398 study isolates. The phylogeny was based on the core genomes of the different S. aureus ST398 isolates included in the present study. The presence (+) or absence (-) of particular virulence genes is indicated. Col, colonization; inf, infection; ND, not determined.
Figure 1. Numbers of identified extracellular proteins of the investigated S. aureus ST398 isolates and their predicted subcellular locations. For all identified extracellular proteins of the investigated strains, the subcellular locations were predicted bioinformatically. Subsequently, the respective numbers of proteins assigned to the different subcellular locations were determined per strain (marked in color code). The different clades of the investigated LA-ST398 and human-originated S. aureus ST398 strains are indicated.
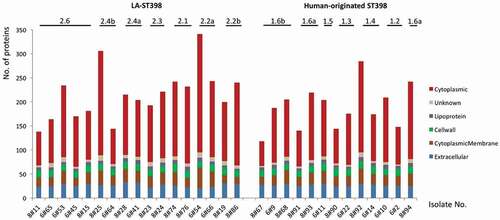
Figure 2. Principal component analysis (PCA) based on the normalized spectral counts of identified extracellular proteins. Two-dimensional PCA plots are displayed for extracellular proteins of the investigated LA-ST398 and human-originated S. aureus strains. The PCA analysis was performed on (a) all identified extracellular proteins, and (b) all identified extracellular proteins except the extracellular cytoplasmic proteins (ECPs).
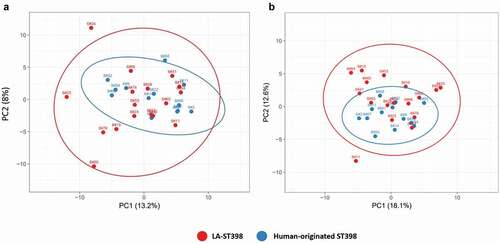
Figure 3. Functional categories and relative abundance of identified extracellular proteins from the investigated LA-ST398 and human-originated ST398 S. aureus strain. Voronoi treemaps in the panels on the left show the “top level functions” (TIGRfam level 1) and “sub level functions” (TIGRfam level 2). The different functional categories are marked in different colors, and the size of each functional category is proportional to the number of identified proteins with the respective function. Voronoi treemaps on the right represent the relative abundance of individual extracellular proteins from LA-ST398 strains (top-right panel) or human-originated ST398 strains (bottom-right panel). Each protein is represented by a polygon-shaped tile and its relative average protein abundance is indicated in color code.
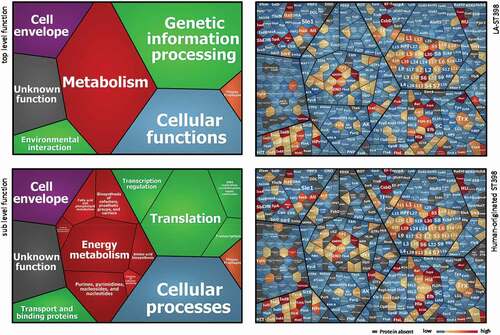
Figure 4. Extracellular virulence factors of the investigated LA-ST398 and human-originated ST398 strains. (a) A total number of 48 virulence factors was identified in all the investigated S. aureus ST398 isolates. Color-coded bars represent the identified proteins and their relative abundance based on normalized spectral counts. (b) The presence of the SCIN protein was assessed by Western blotting using the SCIN-specific monoclonal antibody 6D4.
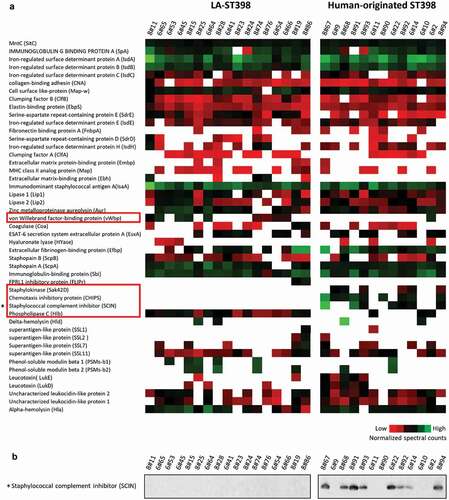
Figure 5. Virulence profile of the 30 investigated S. aureus ST398 isolates in G. mellonella. To profile the virulence of the investigated S. aureus ST398 strains, three independent G. mellonella infection experiments were performed. Per experiment, each investigated S. aureus ST398 strain was used to inoculate 10 G. mellonella larvae (30 larvae/strain in total). Each individual larva was inoculated with 2.5 × 10⁵ CFUs of the respective S. aureus ST398 strain. Larval killing was assessed at 48 h post inoculation. All values are the mean ± the standard deviation of the three independent infection experiments.
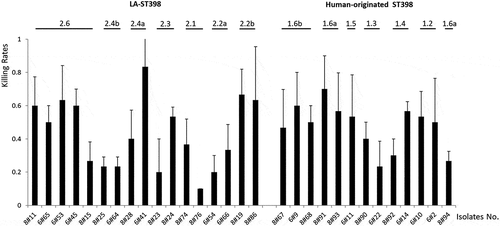
Figure 6. Attenuation of Sbi- and SpA-deficient S. aureus strains in the G. mellonella infection model. (a) Survival curves of G. mellonella larvae (n = 30) inoculated with 2.5 × 10⁶ CFUs of S. aureus strain USA 300 or the isogenic sbi mutant strain. (b) Survival curves of G. mellonella larvae (n = 30) inoculated with 2.5 × 10⁶ CFUs of S. aureus strain Newman or the isogenic spa mutant strain. Larval survival was assessed at 24, 48 and 72 h post infection. The statistical significance of the observed differences in the larval survival was assessed using a Wilcoxon test (Δsbi versus USA 300, P = 0.0484; Δspa versus Newman, P = 0.0068).
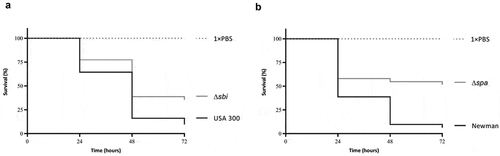
Figure 7. Cytotoxicity profile of the 30 investigated S. aureus ST398 isolates in HeLa cells. Hela cells were infected with bacteria at a MOI of 50:1. Upon 3 h incubation, the non-internalized bacteria were eliminated by washing the cells twice in fresh medium, and by bacterial killing with lysostaphin immediately after the last washing step. Subsequently, the HeLa cell viability was assayed by measuring the reduction of MTT. The results are presented as the percentage of MTT reduction relative to the uninfected control. The cytotoxicity of each S. aureus ST398 strain was assessed in three independent experiments. The two red lines mark the average MTT reduction upon HeLa cell infection with the investigated LA-ST398 or human-originated ST398 strains, respectively.
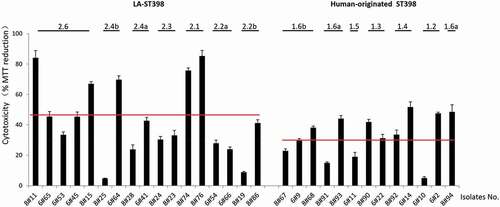
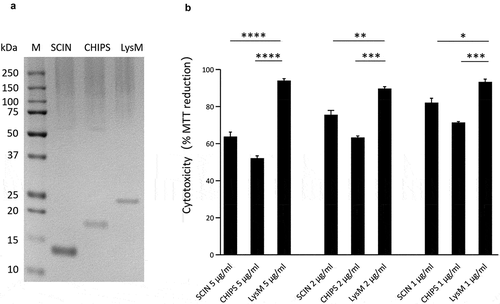
Figure 8. Cytotoxicity of the SCIN and CHIPS proteins. (a) LDS-PAGE analysis of the purified S. aureus SCIN and CHIPS proteins, and the LysM domain of the S. aureus Sle1 protein. (b) To assay the cytotoxicity of SCIN, CHIPS and LysM domain, HeLa cells were incubated with different amounts of the purified proteins for 24 h. Subsequently, the viability of the HeLa cells was assayed by measuring the reduction of MTT. The statistical significance of the observed differences in the killing of HeLa cells was assessed using one-way ANOVA and a subsequent Dunnett correction to adjust the P-values (SCIN 5 μg/ml vs. LysM 5 μg/ml, P < 0.0001; CHIPS 5 μg/ml vs. LysM 5 μg/ml, P < 0.0001; SCIN 2 μg/ml vs. LysM 2 μg/ml, P = 0.0053; CHIPS 2 μg/ml vs. LysM 2 μg/ml, P = 0.0003; SCIN 1 μg/ml vs. LysM 1 μg/ml, P = 0.0102; CHIPS 1 μg/ml vs. LysM 1 μg/ml, P = 0.0006). *, P < 0.05; **, P < 0.01; ***, P < 0.001; ****, P < 0.0001; P < 0.05 was considered significant.