Figures & data
Figure 1. Gene expression of epimastigotes and metacyclic trypomastigotes. Volcano matrix to compare differentially expressed genes (DEGs) between metacyclic trypomastigotes (MTs) and epimastigotes (EPs), indicating the total number of down- and upregulated DEGs in metacyclic trypomastigotes.
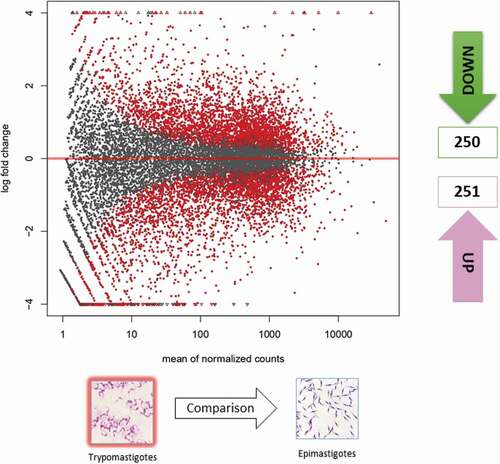
Figure 2. Gene ontology terms. (a) Gene ontology terms corresponding to the 15 most down and upregulated biological process from differential expressed genes obtained when were compared metacyclic trypomastigotes with epimastigotes; The ontological terms for the downregulated genes are in green and the ontological terms for the upregulated genes in pink. (b) Total proportions of ontology terms downregulated (upper) and upregulated (lower).
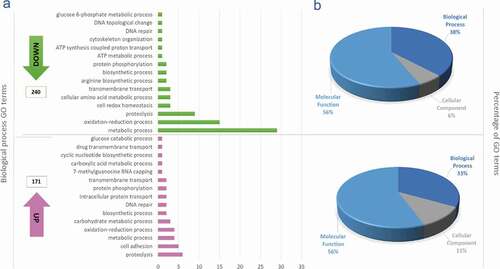
Figure 3. Glucose energy processes. Differentially expressed genes (DEGs) in Metacyclic trypomastigotes in comparison with epimastigotes in the metabolism of glycolysis, pyruvate, and the Krebs cycle (downregulated genes in green and upregulated genes in pink).
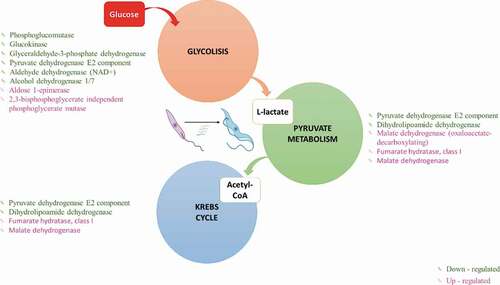
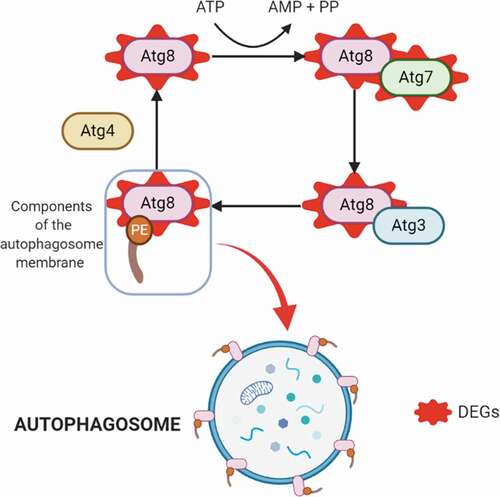
Figure 4. Autophagy process. Upregulated DEGs in autophagy (in red). The cysteine protease Atg4 cuts the arginine residue in the C-terminal part of Atg8, and immediately Atg8 is transferred to Atg7 and Atg3, and finally to the substrate phosphatidylethanolamine (PE); this complex (Atg8-PE) is part of the autophagosome membrane components.