Figures & data
Figure 1. Ssads gene deficiency impedes S. suis entry into mouse brains. (a–c) Six-week-old female C57BL/6 mice were infected i.p. with approximately 5 × 10⁶ CFU of the S. suis WT strain 05ZYH33 (n = 10), the ssads-deficient mutant Δssads (n = 10), or sterile THY media (n = 3). Bacterial counts in the blood (CFU/mL blood) at 5 h and 72 h post-infection (a) and brain (CFU/g tissue) at 72 h post-infection (b) were determined. (c) After correction for blood contamination using CFU in blood and a conservative estimate of the mouse cerebral blood volume (2.5 mL per 100 g tissue), the ratio of brain:blood CFU at 72 h post-infection was determined. Horizontal lines and error bars denote the median and IQR, respectively. *P < 0.05, **P < 0.01, Mann-Whitney U test. (d) Histopathology of representative brain tissues from mice injected with THY media (Mock), infected with S. suis WT strain or infected with the Δssads mutant. Dotted box regions are magnified to better indicate hemorrhage (white arrows) and polymorphonuclear leukocyte infiltration (black arrows). Scale bar indicates 100 µm.
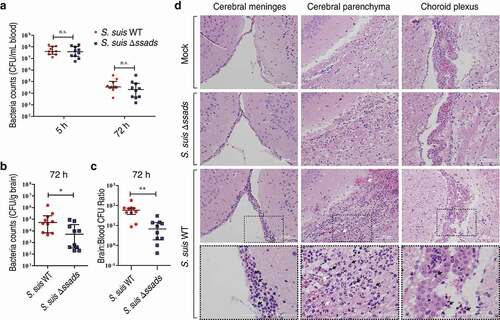
Figure 2. The 5ʹ-nucleotidase activity of Ssads contributes to S. suis translocation across the monolayers derived from human brain microvascular endothelial cells. After HCMEC/D3 cells formed confluent and tight monolayers on transwell filters, S. suis strains were added to the apical surfaces of monolayers at an MOI of 100. (a) In the presence or absence of APCP (500 µM), a known 5ʹ-nucleotidase inhibitor, S. suis cells in the lateral chamber after 1 h were quantitated. (b) The effect of the adenosine analog NECA (1 µM) on bacterial translocation across HCMEC/D3 monolayers at 1 h post-treatment was determined. (c–d) The permeability coefficient to Lucifer yellow (LY) of HCMEC/D3 monolayers was measured 1 h post-infection with S. suis in the presence or absence of APCP (500 µM; c) or NECA (1 µM; d). Data are expressed as means and SEM. *P < 0.05, **P < 0.01, ***P < 0.001, 2-tailed Student’s t test. (e–h) The TEER in HCMEC/D3 monolayers infected with S. suis in the presence or absence of APCP (500 µM) (e–g) or NECA (1 µM) (h) was measured. D-mannitol (10 µM) was used as a positive control as it disrupts cell-cell junctions. Data are expressed as means and SEM. ###P < 0.001 analyzed by two-way ANOVA, and the following significant differences (*P < 0.05, ***P < 0.001 by Bonferroni multiple comparison test) between the corresponding groups at the indicated time points are displayed.
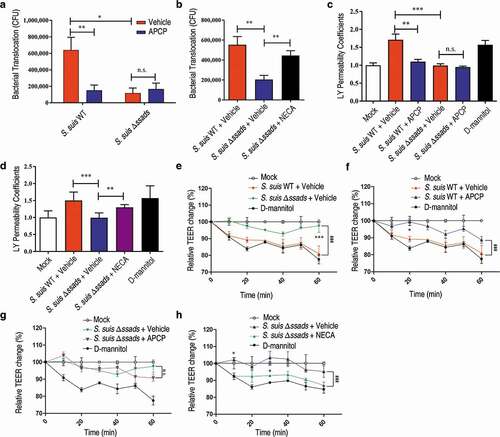
Figure 3. Ssads-mediated adenosine production induces cytoskeletal reorganization and JPs redistribution in S. suis-infected pMBMECs. Primary murine brain microvascular endothelial cells (pMBMECs) were isolated, purified, and cultured from six-week-old female C57BL/6 mice. (a) Immunofluorescence assay for F-actin (red) and ZO-1 (green) in pMBMEC cells was performed 5 h post-infection with S. suis strains WT or Δssads. Nuclei were counter stained with DAPI (blue). Robust short stress fiber formation (white triangle) was visualized using phalloidin staining of F-actin. White arrows indicate paracellular gaps. Scale bar indicates 50 µm.
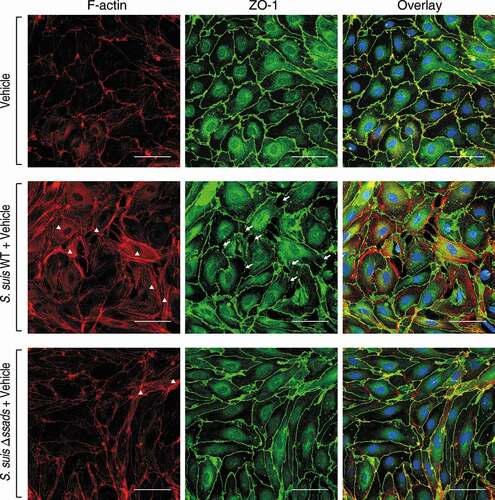
Figure 4. Ssads-mediated AR signaling facilitates S. suis translocation across the BBB in vitro. S. suis strains were added to confluent HCMEC/D3 monolayers at an MOI of 100. (a) The effects of selective AR antagonists DPCPX (100 nM; specific for A1 AR), ZM 241385 (1 µM; specific for A2A AR), and PSB 603 (1 µM; specific for A2B AR) on bacterial translocation across HCMEC/D3 monolayers at 1 h post-infection were determined. (b) The cellular cAMP content of HCMEC/D3 cells was measured 1 h post-infection with S. suis cells. (c) The effects of Rp-cAMPS (200 µM) – a competitive antagonist of cAMP-induced activation of PKA – on bacterial translocation across HCMEC/D3 monolayers at 1 h post-infection were determined. (d) The effects of the selective A1 AR agonist CCPA (1 µM) and adenosine (10 µM) on bacterial translocation across HCMEC/D3 monolayers at 1 h post-infection were determined. Data are expressed as means ± SEM. *P < 0.05, **P < 0.01, ***P < 0.001, two-tailed Student’s t test.
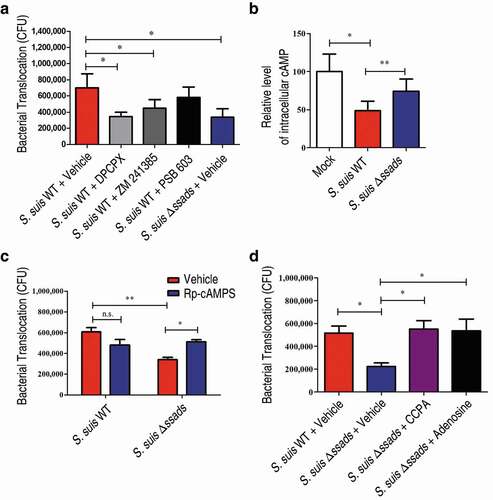
Figure 5. A1 AR activation promotes S. suis BBB penetration. (a) The translocation of S. suis across monolayers of HCMEC/D3 A1 AR-KO cells or HCMEC/D3 unedited cells was measured at 1 h post-infection. Data are expressed as means ± SEM. (b,c) Six-week-old female C57BL/6 mice were infected i.p. with approximately 5 × 10⁶ CFU of S. suis strains. Bacterial CFU in the blood and brain were measured from animals sacrificed at 72 h post-infection. Horizontal lines and error bars denote the median and IQR, respectively. (b) The effects of CCPA (0.37 mg/kg BW) i.v. at 2 h post-infection on the bacterial loads in the brain and blood were determined (n = 11 mice per group). (c) The effects of administration of DPCPX (1 mg/kg BW) concomitantly with bacterial suspension by the i.p. route on the bacterial loads in the brain and blood were determined (n = 8 mice per group). (d) Comparison of bacterial CFU recovered from the blood and recovered from brains of unedited and A1 AR-KO mice 72 h after i.p. challenge with 5 × 10⁶ CFU of S. suis WT strain were performed (n = 8 mice per group). Horizontal lines and error bars denote the median and IQR, respectively. *P < 0.05, **P < 0.01, ***P < 0.001, Mann-Whitney U test.
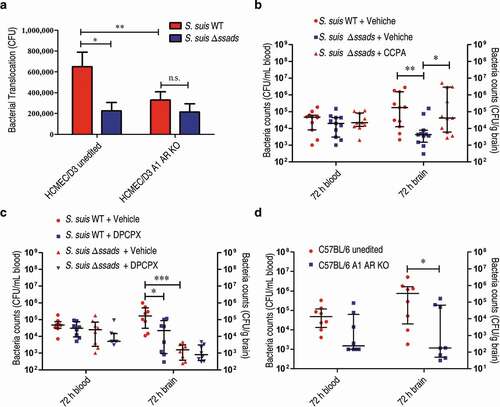
Figure 6. Adenosine production by other bacterial species is involved in bacterial translocation across the BBB. (a) The effects of the 5ʹ-nucleotidase inhibitor APCP (500 µM) on the translocation of GBS, S. aureus, or S. epidermidis across HCMEC/D3 monolayers at 1 h were determined. Data are expressed as means and SEM. *P < 0.05, **P < 0.01, two-tailed Student’s t test. (b–d) Six-week-old male CD1 mice were injected via the tail vein with 108 CFU of GBS. The effects of administration of APCP i.p. 2 h prior to challenge on the progression of GBS meningitis were determined. Bacterial burdens in the blood (b) or brain (c), as well as the ratio of brain:blood CFU (d) were determined 72 h post-infection (n = 8 mice per group). Brain CFUs were corrected for blood contamination using the blood CFU and a conservative estimate of the mouse cerebral blood volume (2.5 mL per 100 g tissue). Horizontal lines and error bars denote the median and IQR, respectively. *P < 0.05, Mann-Whitney U test.
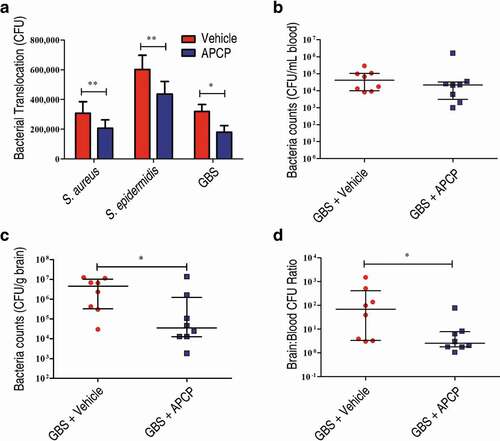
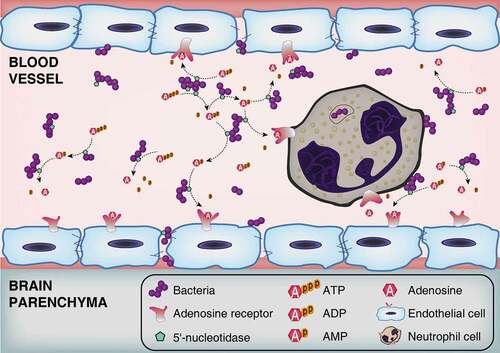
Figure 7. Schematic model of BBB disruption induced by bacterial 5ʹ-nucleotidase. Bacteria increase the extracellular concentration of adenosine catalyzed by 5ʹ-nucleotidase. Thereafter, through occupancy of the A2A AR on neutrophil cells, adenosine acts to perturb immune defenses. Abnormally elevated adenosine levels can also destroy the integrity of CNS barriers by activating A1 AR expressed on brain endothelial cells. As bacteria proliferate and adenosine impairs the function of immune and endothelial cells, infected individuals gradually develop bacteremia and meningitis.