Figures & data
Table 1. Strains and plasmids.
Figure 1. Western blot analysis of B. mallei WT and recombinant strains. Whole cell lysates were prepared from WT B. mallei ATCC 23344 bacteria (lane 1) and the pal KO mutant strain carrying the plasmids pBHR1∆Dra (lane 2) and pPalBm (lane 3) and analyzed by Western blotting with the monoclonal antibody PalBm MAb#2 (panel A) and polyclonal antibodies against the LolC protein (panel B, used as loading control to demonstrate that equivalent amounts of proteins were analyzed). Molecular mass markers are shown to the left in kilodaltons. Lane 4 in panel A corresponds to 5 ug of purified of His-tagged PalBm protein (used as positive control to demonstrate reactivity and specificity of PalBm MAb#2).
Figure 2. Effect of osmotic and antibiotic stresses on the growth of B. mallei WT and recombinant strains. Plate-grown organisms were suspended in PBS to a concentration of 1 × 10⁹ CFU/mL. Ten-fold serial dilutions of bacterial suspensions were then spotted onto agar plates and incubated at 37ºC for 40 hours. (a) Medium without supplement. (b) Medium supplemented with 100 mM potassium chloride for osmotic stress. (c) Medium supplemented with 20 ug/mL of the antibiotic Polymyxin B. The number of CFU spotted on the agar plates is shown to the right of each panel. Images are representative of 3 independent experiments.
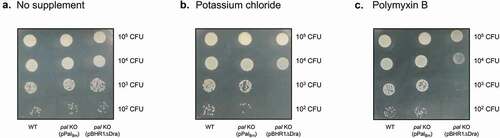
Figure 3. Polymyxin B sensitivities of B. mallei WT and recombinant strains. Plate-grown organisms were suspended in PBS to a concentration of 1 × 10⁹ CFU/mL. Portions of bacterial suspensions (108 CFU) were then spread onto agar plates and E strips containing a gradient of Polymyxin B concentrations (0.064–1024 ug/mL, Biomerieux) were applied onto the inoculated medium. After incubation at 37ºC for 40 hours, minimal inhibitory concentration (MIC) values were determined by reading the intersection of the test strip with the lower part of the ellipse-shaped area of bacterial growth inhibition. (a) WT B. mallei ATCC 23344. (b) pal KO mutant carrying vector control pBHR1∆Dra. (c) pal KO mutant carrying plasmid pPalBm. Images are representative of 3 independent experiments. MIC values are shown at the bottom of each panel.
Figure 4. Serum resistance, intracellular fitness, and in vitro replication rate in liquid cultures of B. mallei WT and recombinant strains. (a) Plate-grown bacteria were suspended in PBS and used to infect 3 wells of duplicate tissue culture plates seeded with murine J774 macrophages (multiplicity of infection of 10:1). The infected cells were incubated for 1 hour at 37ºC to allow phagocytosis of the bacteria, washed, and treated with antibiotic for 2 hours to kill extracellular bacteria. Cells from one tissue culture plate were lysed, diluted, and plated onto agar medium to determine the number of bacteria phagocytized. The other tissue culture plate was incubated for an additional 7 hours, after which the cells were washed, lysed, diluted, and spread onto agar plates to calculate the number of intracellular organisms. The results are expressed as the mean CFU per well. The assays were performed on 3 separate occasions. The graph shows cumulative results. The error bars correspond to standard errors of the mean. The asterisk indicates that the reduction in the number of intracellular pal KO bacteria carrying the vector pBHR1∆Dra at 10 hours post-infection, compared to WT B. mallei and the pal KO mutant carrying plasmid pPalBm, is statistically significant. The reduction in the number of intracellular pal KO bacteria carrying plasmid pPalBm at 10 hours post-infection, compared to WT B. mallei, was not statistically significant. (b) Plate-grown bacteria were suspended in broth to an optical density at wavelength 600 nm (ABS600 nm) of 0.1. Following this, suspended bacteria were incubated at 37ºC with shaking (200-rpm) and the optical density of cultures was measured at the indicated time intervals. Strains were tested on at least 2 separate occasions. The graph shows cumulative results. The error bars correspond to standard errors of the mean. (c) Plate-grown bacteria were suspended in PBS supplemented with Mg+2 and Ca+2 and aliquots containing 103 CFU were placed in duplicate tubes. Following this, normal human serum was added to the bacteria at a final concentration of 25% and the mixtures were incubated at 37ºC. Portions were removed at the indicated time points and plated onto agar medium to determine the number of viable organisms. The results are expressed as the mean percentage of the original inoculum (time 0 min) remaining at each time point. The assays were performed on 4 separate occasions. The graph shows cumulative results. The error bars correspond to standard errors of the mean. The asterisk indicates that the reduction in the number of pal KO bacteria carrying the vector pBHR1∆Dra and surviving exposure to serum, compared to WT B. mallei and the pal KO mutant carrying plasmid pPalBm, is statistically significant. The hashtag indicates that the reduction in the number of pal KO bacteria carrying plasmid pPalBm and surviving exposure to serum, compared to WT B. mallei, is statistically significant.
Figure 5. Median lethal dose comparison for B. mallei WT and recombinant strains. BALB/c mice were inoculated with a Microsprayer device to aerosolize the indicated numbers of bacterial CFU directly into the lungs (n = 5 mice/dose). The animals were then monitored daily for clinical signs of illness and morbidity. (a) Survival data and calculated LD50 values. (b–d) Tissues were collected from mice that survived challenge (day 22), homogenized, diluted, and spread on agar plates to determine bacterial loads. The symbols represent data from individual animals; horizontal lines represent the mean total number of CFU for each group.
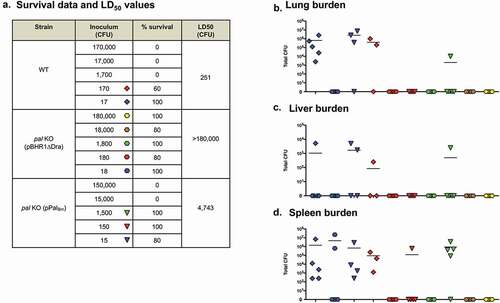
Figure 6. Median lethal dose comparison for B. mallei WT and recombinant strains (repeat experiment). BALB/c mice were inoculated with a Microsprayer device to aerosolize the indicated numbers of bacterial CFU directly into the lungs (n = 5 mice/dose). The animals were then monitored daily for clinical signs of illness and morbidity. (a) Survival data and calculated LD50 values. (b–d) Tissues were collected from mice that survived challenge (day 27), homogenized, diluted, and spread on agar plates to determine bacterial loads. The symbols represent data from individual animals; horizontal lines represent the mean total number of CFU for each group.
Figure 7. ELISA using serum from mice challenged with B. mallei WT and recombinant strains. Serum samples were serially diluted and placed in duplicate wells of plates coated with whole paraformaldehyde-fixed B. mallei ATCC 23344 bacteria (panel A) and with purified His-tagged PalBm protein (panel B). Alkaline-phosphatase-conjugated goat anti-IgG mouse antibodies (light and heavy chains) were used for detection. Serum samples were tested in duplicate on at least 2 separate occasions. The results are expressed as the mean (plus standard error) reciprocal endpoint titers. Naïve serum was used to establish background reactivity, and the endpoint titers correspond to the highest immune serum dilutions giving ELISA values greater than the mean value of naïve serum plus 3 standard deviations. The labels on the x-axis show the source of immune serum samples (collected from survivors in experiments to determine the LD50 of B. mallei WT and recombinant strains, see and ). The asterisks indicate that the increase in serum titers, compared to samples from mice infected with pal KO (pBHR1∆Dra) bacteria, is statistically significant. The hashtags indicate that the increase in serum titers, compared to samples from mice infected with WT bacteria, is statistically significant.
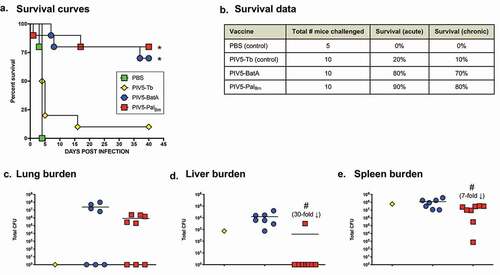
Table 2. Vaccine studies to evaluate protection by the pal KO mutant strain.
Figure 8. Characterization of recombinant PIV5 virus expressing PalBm. (a) Schematic of PIV5-PalBm vaccine construct. NP, nucleoprotein; V, V protein; P, phosphoprotein; M, matrix protein; F, fusion protein; SH, small hydrophobic protein; HN, hemagglutinin-neuraminidase protein; L, RNA-dependent RNA polymerase; PalBm, B. mallei Pal protein residues 22–170. (b) Equivalent protein amounts of lysates from cells infected with PIV5-PalBm and PIV5 viruses were analyzed by Western blotting with mouse PalBm-specific polyclonal and PIV5-P/V antibodies. Lane 1 = mock infected cells; Lane 2 = purified His-tagged PalBm; Lane 3 = cells infected with WT PIV5 virus; Lane 4 = cells infected with PIV5-PalBm virus (c) MDBK cells were infected in triplicate with PIV5-PalBm and PIV5 viruses at an MOI of 0.01. Aliquots of supernatant from the infected cell cultures were collected at 24-hour intervals for a period of 5 days post-infection and titers were determined by plaque assays using BHK21 cells. The results are expressed as the mean (± standard error of the mean) log10 PFU/mL. There was no statistically significant difference between viruses.
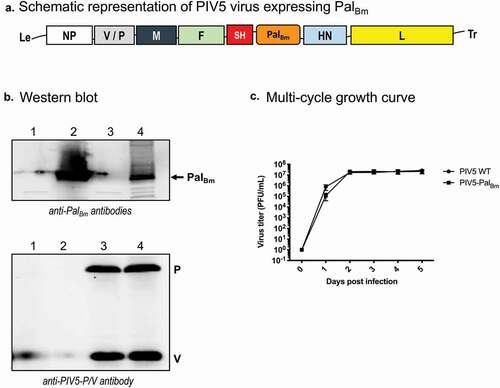
Figure 9. Vaccination with PIV5-PalBm provides protection against challenge with a lethal dose of WT B. mallei. BALB/c mice vaccinated intranasally with PIV5 viruses were challenged with 10 LD50 of B. mallei ATCC 23344 using a Microsprayer device and monitored daily for clinical signs of illness and morbidity. (a) Kaplan-Meier survival curves. (b) Survival data during the acute (days 1 through 10 post-challenge) and chronic (days 11 through 40 post-challenge) phases of infection. (c–e) At study end-points, tissues collected from survivors were homogenized, diluted, and spread on agar plates to determine bacterial loads. Symbols represent individual animals; horizontal lines show the mean total CFU for each group. The asterisks indicate that the survival curves were found to be significantly different from mice vaccinated with PBS and the control vaccine PIV5-Tb. The hashtags indicate that the decrease in bacterial burden, compared to mice vaccinated with PIV5-BatA, is statistically significant. Although a 30-fold decrease in lung bacterial burden was observed between mice vaccinated with PIV5-PalBm and PIV5-BatA, this decrease was not statistically significant (panel C).