
Figures & data
Table 1. Survival of mycoplasmas preincubated with or without factor H in swine sera.
Table 2. Primers for recombinant expression of ef-tu with a restriction site of BamH I and Xho I based on homologous recombination technology.
Figure 1. The factor H binding ability of M. hyopneumoniae strain 168 and its influence on M. hyopneumoniae survival in swine sera.
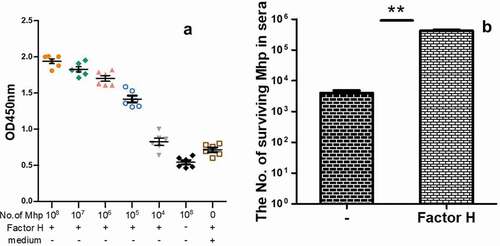
Table 3. Summary of the analysis performed on the protein spots identified using MALDI-TOF-MS/MALDI-TOF-TOF-MS.
Figure 2. Identification of important factor H binding proteins of M. hyopneumoniae.
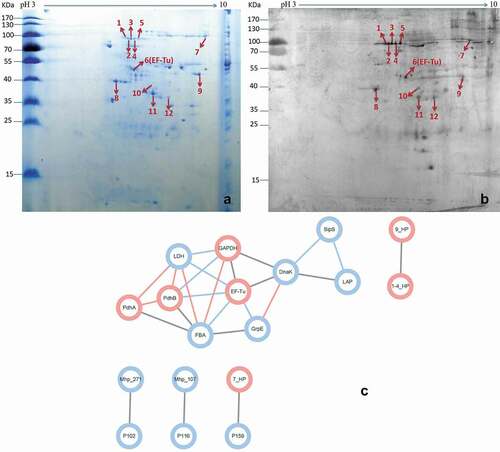
Figure 3. The interaction of M. hyopneumoniae elongation factor thermo unstable (EF-Tu) with factor H.
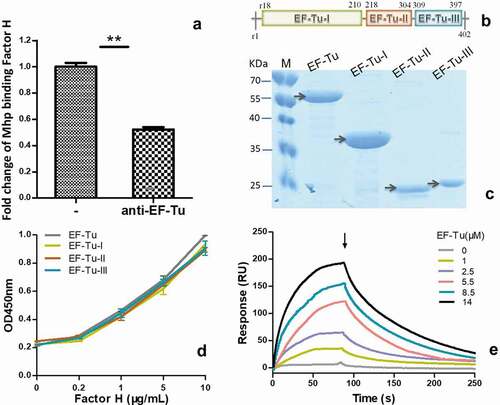
Figure 4. Detection of C3 deposition on the surface of M. hyopneumoniae using flow cytometry.
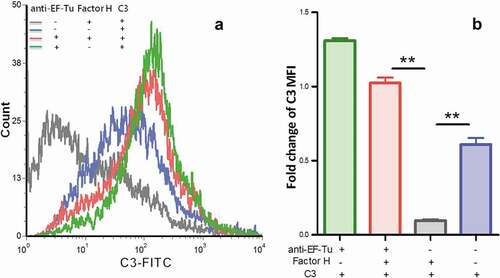
Figure 5. M. hyopneumoniae Adhesion influenced by factor H.
Figure 6. Factor H is predominantly present in the M. hyopneumoniae colonization site.
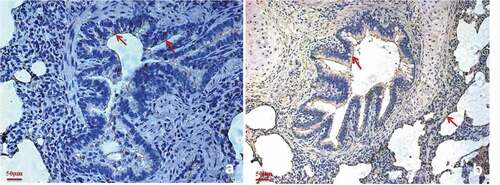
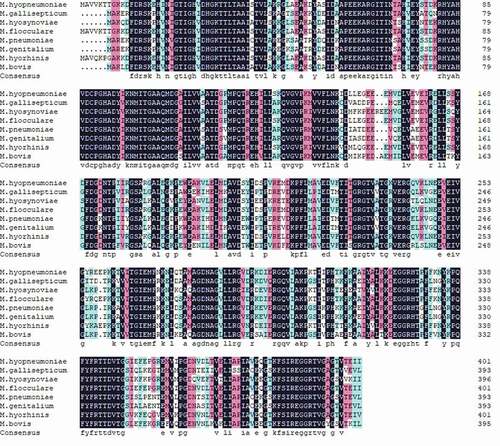
Figure 7. The sequence alignment of EF-Tu proteins from different mycoplasmas.