Figures & data
Table 1. Yeast strains used in this study.
Figure 1. M. sexta caterpillars are susceptible to infections with C. albicans at their standard maintenance temperature of 25°C. (a) 13-day old M. sexta fifth instar caterpillar prior to injection, weighing ~2 g. Its distinguishing feature, the reddish horn at the posterior, is clearly visible. (b) 24 hours post injection with the C. albicans wild-type strain SC5314, the dead animal on the left has lost color and turgidity compared to the live PBS control animal on the right. (c) Groups of 10 animals were infected with C. albicans SN95 or SC5314 wild-type strains. Kaplan-Meier curves show dose-dependent killing of caterpillars as indicated by the inset p-values for overall differences, excluding PBS controls. (d) Survival curves of 10 animals per group infected with 107 cells of C. albicans mutants that have attenuated virulence phenotypes in mice or epithelial cell models. The hog1∆/∆ and cka2∆/∆ mutants exhibit attenuated virulence, while virulence of the ahr1∆/∆ mutant is comparable to wild type. The hog1∆/∆ mutant differs significantly from the wild type (p = 0.0001), while the complemented strain hog1/hog1::HOG1 kills M. sexta at a level comparable to that of the wild-type strain (p = 0.21). The cka2∆/∆ mutant is significantly less virulent than the wild type (p = 0.00021), while the complemented strain cka2/cka2::CKA2 is not (p = 0.054). Shown is one of two comparable biological replicates.
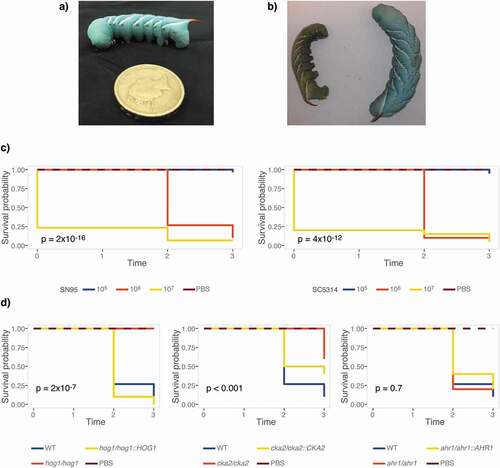
Figure 2. Elevated temperature increases susceptibility of M. sexta to C. albicans. Groups of 10 animals were injected with increasing doses of the C. albicans wild-type strain SC5314 or with 106 cells of the hog1∆/∆ mutant strain and its complemented control and wild-type progenitor and kept at 37°C for the duration of the experiment. (a) M. sexta caterpillars succumb to infection with 105 cells of the laboratory strain SC5314 at 37°C. (b) Weight gain of caterpillars infected with C. albicans was significantly reduced at all doses relative to PBS controls (**** = P < 0.0001). (c) Attenuated virulence of the hog1∆/∆ mutant is retained at 37°C. (d) Animals infected with the hog1∆/∆ mutant gain significantly more weight than those infected with the wild-type strain RM1000 (**** = P < 0.0001). Infection with the hog1/hog1::HOG1 complemented strain resulted in a lack of weight gain comparable to wild type (p = 0.16). Shown is one of two comparable replicates.
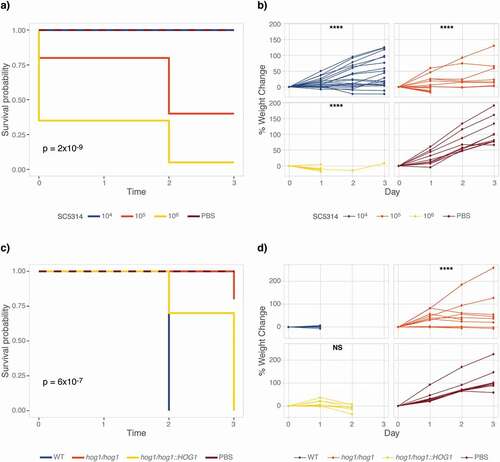
Figure 3. Fungal burden in caterpillar feces and hemolymph as a measure of disease progression. Six animals were injected with either 100 µl 1x PBS or 106 cells of the wild-type strain SN95 or its hog1∆/∆ derivative (YSD883) and maintained at 37°C. On Day 1, two surviving animals were selected from each group for CFU analysis. Colony forming units per gram feces (a) and 100 µl hemolymph (b) increase in the wild-type strain between Day 2 and 3 but are not detectable in the hog1∆/∆ mutant nor the control animals until Day 3. Each CFU data point represents the average of at least two (usually three to four) technical replicates.
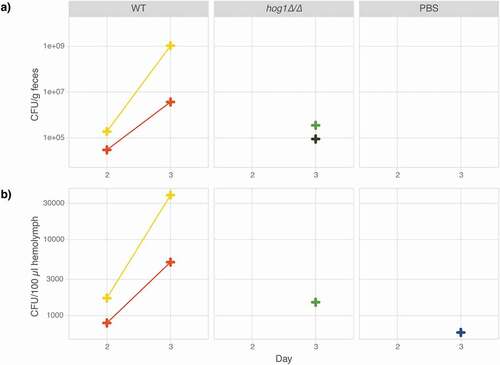
Figure 4. Antifungal efficacy testing of fluconazole and caspofungin. Groups of ten caterpillars infected with 106 cells of C. albicans strain SC5314 were treated with increasing doses of antifungal drugs fluconazole or caspofungin and maintained at 37°C for the duration of the experiment. Differences between drug treatments were evaluated using a log rank test comparing animals injected with different amounts of drug to those injected with drug solvent (water or DMSO) only, excluding PBS injection controls. Weight gain was compared to the PBS control due to low survival in the solvent control group. (a) Animals were scored daily for survival showing survival improved significantly in animals receiving caspofungin treatment. Inset p value relative to drug solvent control. (b) Rate of weight gain, however, remains low (p < 0.0001) for animals that received 2 or 4 mg/kg caspofungin. The peak and drop in weight, marked with a ⊙, is coinciding with the onset of prepupation. This “pupation drop” is due to the animals refraining from food upon entering the early stages of pupation. (c) Fluconazole treatment improves M. sexta survival but weight gain remains low compared to PBS control infected animals (p < 0.005) for all treatments. (d) Weight data were not analyzed for significance due to the lack of surviving animals in the no treatment group.
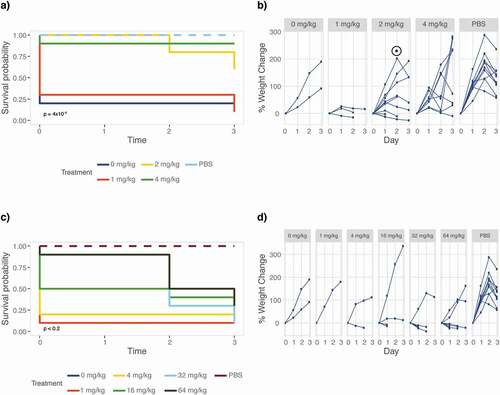
Figure 5. Caterpillars are susceptible to common yeast pathogens. Groups of ten animals were infected with increasing numbers of yeast cells as specified and survival was recorded daily. Inset p values represent results from a log rank test of all treatments excluding PBS. Caterpillars are not susceptible to S. cerevisiae or M. pulcherrima but infections with C. neoformans, C. glabrata, C. auris, and C. albicans result in significantly reduced survival rates.
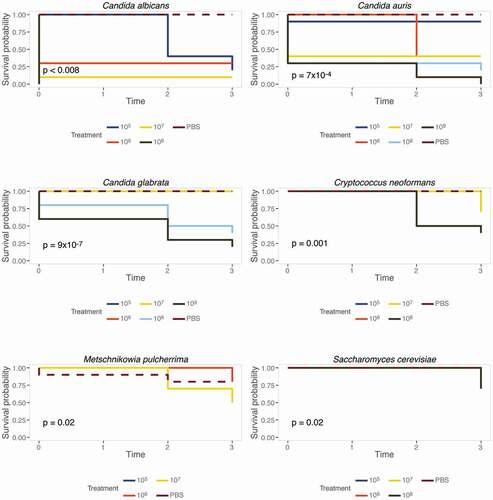
Figure 6. Caterpillar weight as a measure of virulence. Groups of ten animals were infected with increasing amounts of yeast inocula from six different species or PBS and the weight of surviving animals was recorded daily. Weight measures of yeast-infected caterpillars were analyzed for statistical significance revealing that yeast infections affect weight regardless of mortality rates. The slope of each curve at each yeast concentration was compared to the PBS control by fitting a mixed model where caterpillars were treated as a random effect using linear mixed-effects modeling. Statistical significance was assessed as follows: * p < 0.05, ** p < 0.01, *** p < 0.001, **** p < 0.0001.
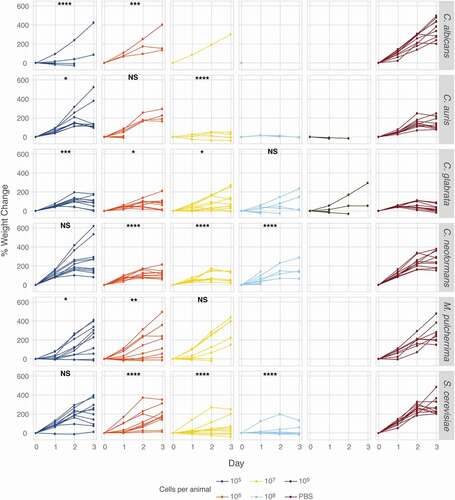
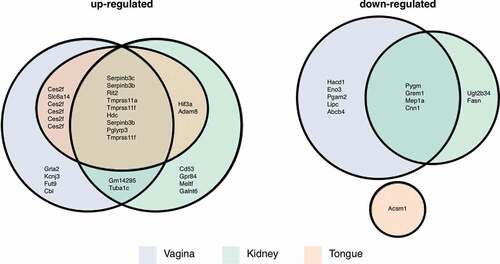
Figure 7. Mouse homologs of M. sexta differentially expressed genes. Numbers of Manduca genes and their murine homologs that were up- or downregulated in mouse vagina, kidney, or tongue and the overlap between the different data sets as depicted in a Euler diagram. Note, in some cases the same mouse gene was the best BLAST match for several M. sexta genes.