
Figures & data
Figure 1. Organization index of infected and control groups of different breeds at different times. S: spleen; T: thymus; B: bursa of fabricius. P: Pengxian yellow chicken; T: Tibetan chicken; A: Avian broilers. All values are represented as the mean ± SEM (n = 3). (*) represents statistical significance (P < 0.05).
Table 1. Overview of quantitative results of each sample.
Table 2. Statistical list of differential proteins.
Figure 2. CV profile of each groups. The horizontal axis is the sample groups, and the vertical axis is the corresponding CV.
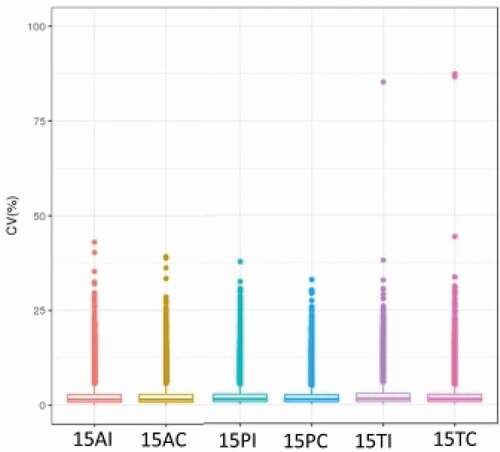
Table 3. Statistical list of pathway enrichment of differentially expressed proteins (DEPs) in the spleens of three breeds (|log2FC|>3).
Figure 3. Protein interaction network analysis of DEPs of spleen development of three breeds. A: 15AC-VS-15PC; B: 15AC-VS-15 TC; C: 15PC-VS-15 TC. “ – ”activation; “ – ”inhibition; “ – ”binding; “ – ”catalysis; “ – ”phenotype; “ – ”posttranslational modification; “ – ”reaction; “ – ”transcriptional regulation; “→”positive; “—”negative; “ – ∙”unspecified.
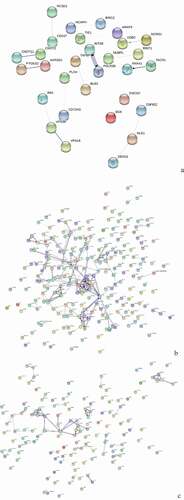
Figure 4. GO Enrichment analysis of DEPs in the spleens of three breeds. A: 15AC-VS-15PC; B: 15AC-VS-15 TC; C: 15PC-VS-15 TC. Cluster frequency means the ratio of annotation is the same GO term between all of DEPs and all of the proteins.
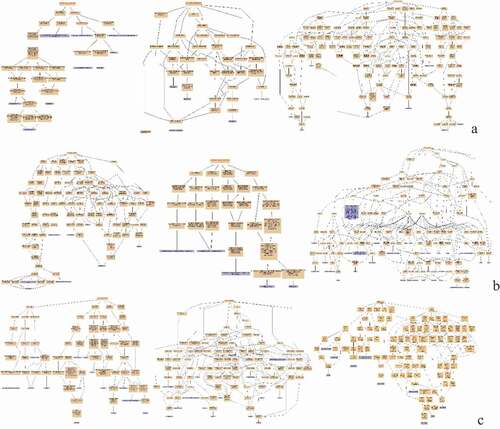
Figure 5. Pathway enrichment analyses of DEPs in spleens of three breeds. A: 15AC-VS-15PC; B: 15AC-VS-15 TC; C: 15PC-VS-15 TC. The enrichment factor is the number of DEPs annotated to the pathway divided by all of the identified proteins annotated to the pathway. The higher the value, the higher the proportion of differentially expressed proteins annotated to this pathway. The dot size in the figure represents the number of DEPs annotated to this pathway.
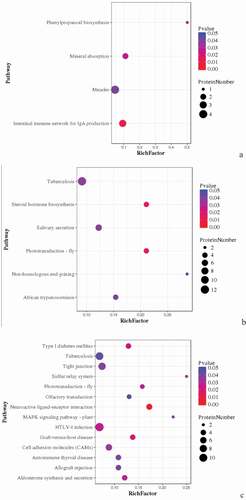
Table 4. Statistical list of pathway enrichment of DEPs in spleens of three breeds after infection with ALV-J (|log2FC|>3).
Figure 6. Protein interaction network analysis of DEPs of spleen of injected groups and control groups of three breeds. A: 15AI-VS-15AC; B: 15PI-VS-15PC; C: 15 TI-VS-15 TC. “ – ”activation; “ – ”inhibition; “ – ”binding; “ – ”catalysis; “ – ”phenotype; “ – ”posttranslational modification; “ – ”reaction; “ – ”transcriptional regulation; “→”positive; “—”negative; “ – ∙”unspecified.
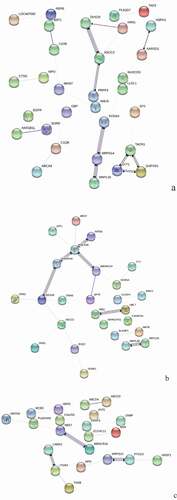
Figure 7. GO Enrichment analysis of DEPs in spleens of injected and control groups of three breeds. A: 15AI-VS-15AC; B: 15PI-VS-15PC; C: 15 TI-VS-15 TC. Cluster frequency means the ratio of annotation is the same GO term between all DEPs and all proteins.
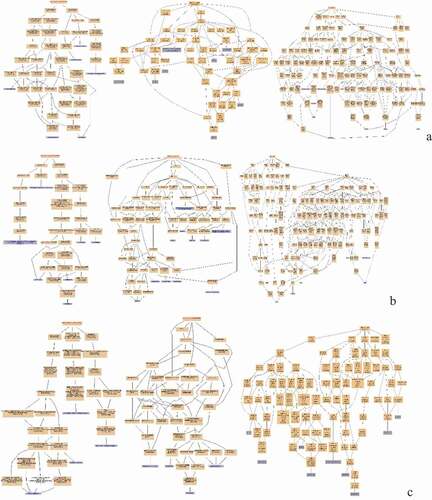
Figure 8. Pathway Enrichment Analysis of DEPs of spleens of injected and control groups of three breeds. A: 15AI-VS-15AC; B: 15PI-VS-15PC; C: 15 TI-VS-15 TC. The enrichment factor is the number of DEPs annotated to the pathway divided by all of the identified proteins annotated to the pathway. The higher the value, the higher the proportion of differentially expressed proteins annotated to this pathway. The dot size in the figure represents the number of DEPs annotated to this pathway.
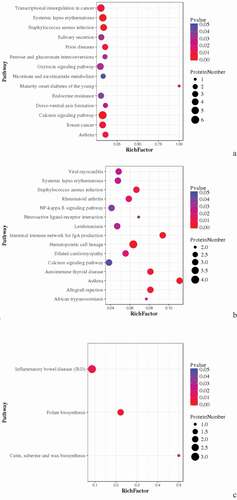
Table 5. Statistical list of pathway enrichment of DEPs in spleens of ALV-J infected comparable groups (|log2FC|>3).
Figure 9. Protein interaction network analysis of DEPs of each comparison group. A: 15A-VS-15P; B: 15A-VS-15 T; C: 15P-VS-15 T. “ – ”activation; “ – ”inhibition; “ – ”binding; “ – ”catalysis; “ – ”phenotype; “ – ”posttranslational modification; “ – ”reaction; “ – ”transcriptional regulation; “→”positive; “—”negative; “ – ∙”unspecified.
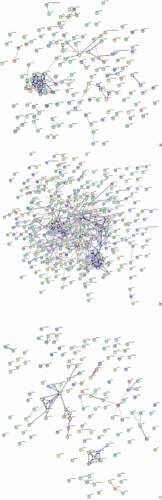
Figure 10. GO enrichment analysis of DEPs of each comparison group. A: 15A-VS-15P; B: 15A-VS-15 T; C: 15P-VS-15 T. Cluster frequency means the ratio of Annotation is the same GO term between all DEPs and all proteins.
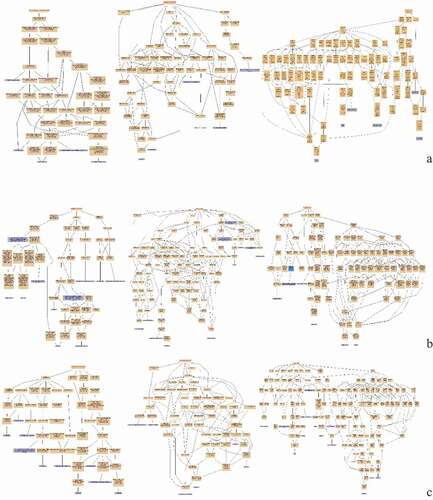
Figure 11. Pathway enrichment analyses of DEPs of each comparison group. A: 15A-VS-15P; B: 15A-VS-15 T; C: 15P-VS-15 T. The enrichment factor is the number of DEPs annotated to the pathway divided by all of the identified proteins annotated to the pathway. The higher the value, the higher the proportion of differentially expressed proteins annotated to this pathway. The dot size in the figure represented the number of DEPs annotated to this pathway.
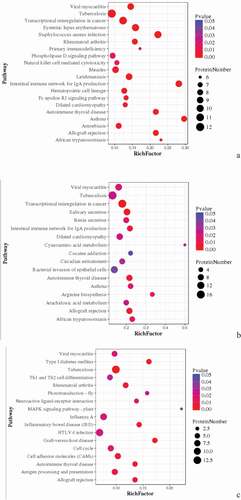
Table 6. Comparison of differential proteins from MRM and DIA.