Figures & data
Table 1. List of primers used for the detection ofthe enterotoxins, hemolysin, fibronectin-binding protein, and exfoliative toxins genes.
Figure 1. Hemolytic activities ofclinical S. haemolyticus isolates compared to S. aureus and controlS. haemolyticus (ATCC 29970) after 5 h of incubation. SH; S. haemolyticus, SA; S. aureus. Depicted are the mean of 3 independent experiments ± standard deviation.
Table 2. Analysis of the different virulence-associated genes expressed by S. haemolyticus.
Figure 2. Bacterial adhesion to PHSF cells as detected by Giemsa stain. After 3 h in culture, PHSF cells were challenged with different S. haemolyticus isolates. (a) Non-infected fibroblast cells, (b) Fibroblasts infected with S. haemolyticus isolate with low adhesion capacity, (c) Fibroblasts infected with S. haemolyticus isolate with high adhesion capacity, (d) Fibroblasts infected with the control S. haemolyticus strain (ATCC 29970) showing low adhesion capacity.
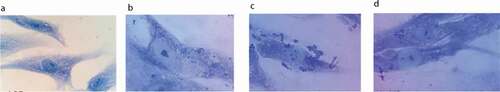
Figure 3. The PHSF cells were challenged withS. haemolyticus at an MOI of 10 and examined with TEM. (a) After 15 min of infection, extracellular bacteria were observed (3600x) which were further magnified (14,000 x) in (b). (c) After 1 h of infection, bacteria invaded the cells and became engulfed (3600 x). (d) Initialization of phagocytosis. (e) After 90 min, S. haemolyticus entered the PHSF cells and become localized in vacuoles (3600 x). (f) Proliferating bacteria are shown inside the vacuole.
Table 3. Summary of the frequency of virulence genes and invasion efficiencies of theS. haemolyticus strains.
Figure 4. Invasion of PHSF cells by FITC-labeled bacteria. Comparative histograms represent results of flow cytometry analysis of (a) control non-infected cells (mock), (b) poorly invasive strain of S. haemolyticus (SH1), (c) highly invasive strain of S. haemolyticus (SH10), (d) Control S. haemolyticus strain (ATCC 29970). The figure shows a representative of three independent experiments.
Figure 5. Percentage of internalizedS. haemolyticus in the PHSF cells and the distribution of the fnBP genes.
Figure 6. Effect of Staphylococci on the proliferation rate of PHSF cells measured by MTT assay. Data are represented as the mean of 3 experiments ± standard error.
Figure 7. Flow cytometry analysis showing the cytotoxic effect of SH and SA on the PHSF cells. Cells were treated with indicated microbial products and stained after 24 h of incubation with Annexin V and PI. (a) Cells were infected with SH (upper panel), while in (b) cells were infected with SA (lower panel). (c) The mean of the cytotoxic activities of different tested strains on the PHSF cells ± SD. SH, S. haemolyticus; SA,S. aureus.
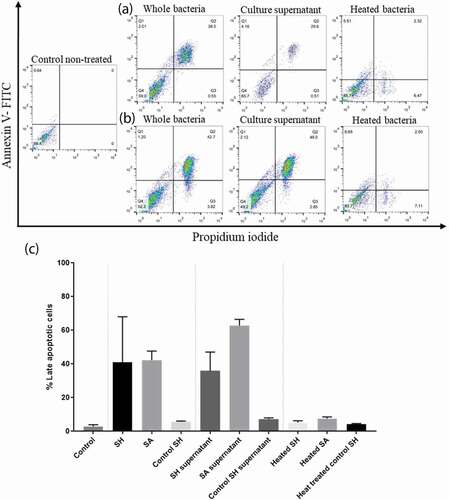
Figure 8. Cytokine expression profile of PBMCs incubated with S. haemolyticus and S. aureus for 6 and 24 h. The figure shows the mean of 3 independent experiments ± standard error.